
Global Hydrogen Industry Landscape Report
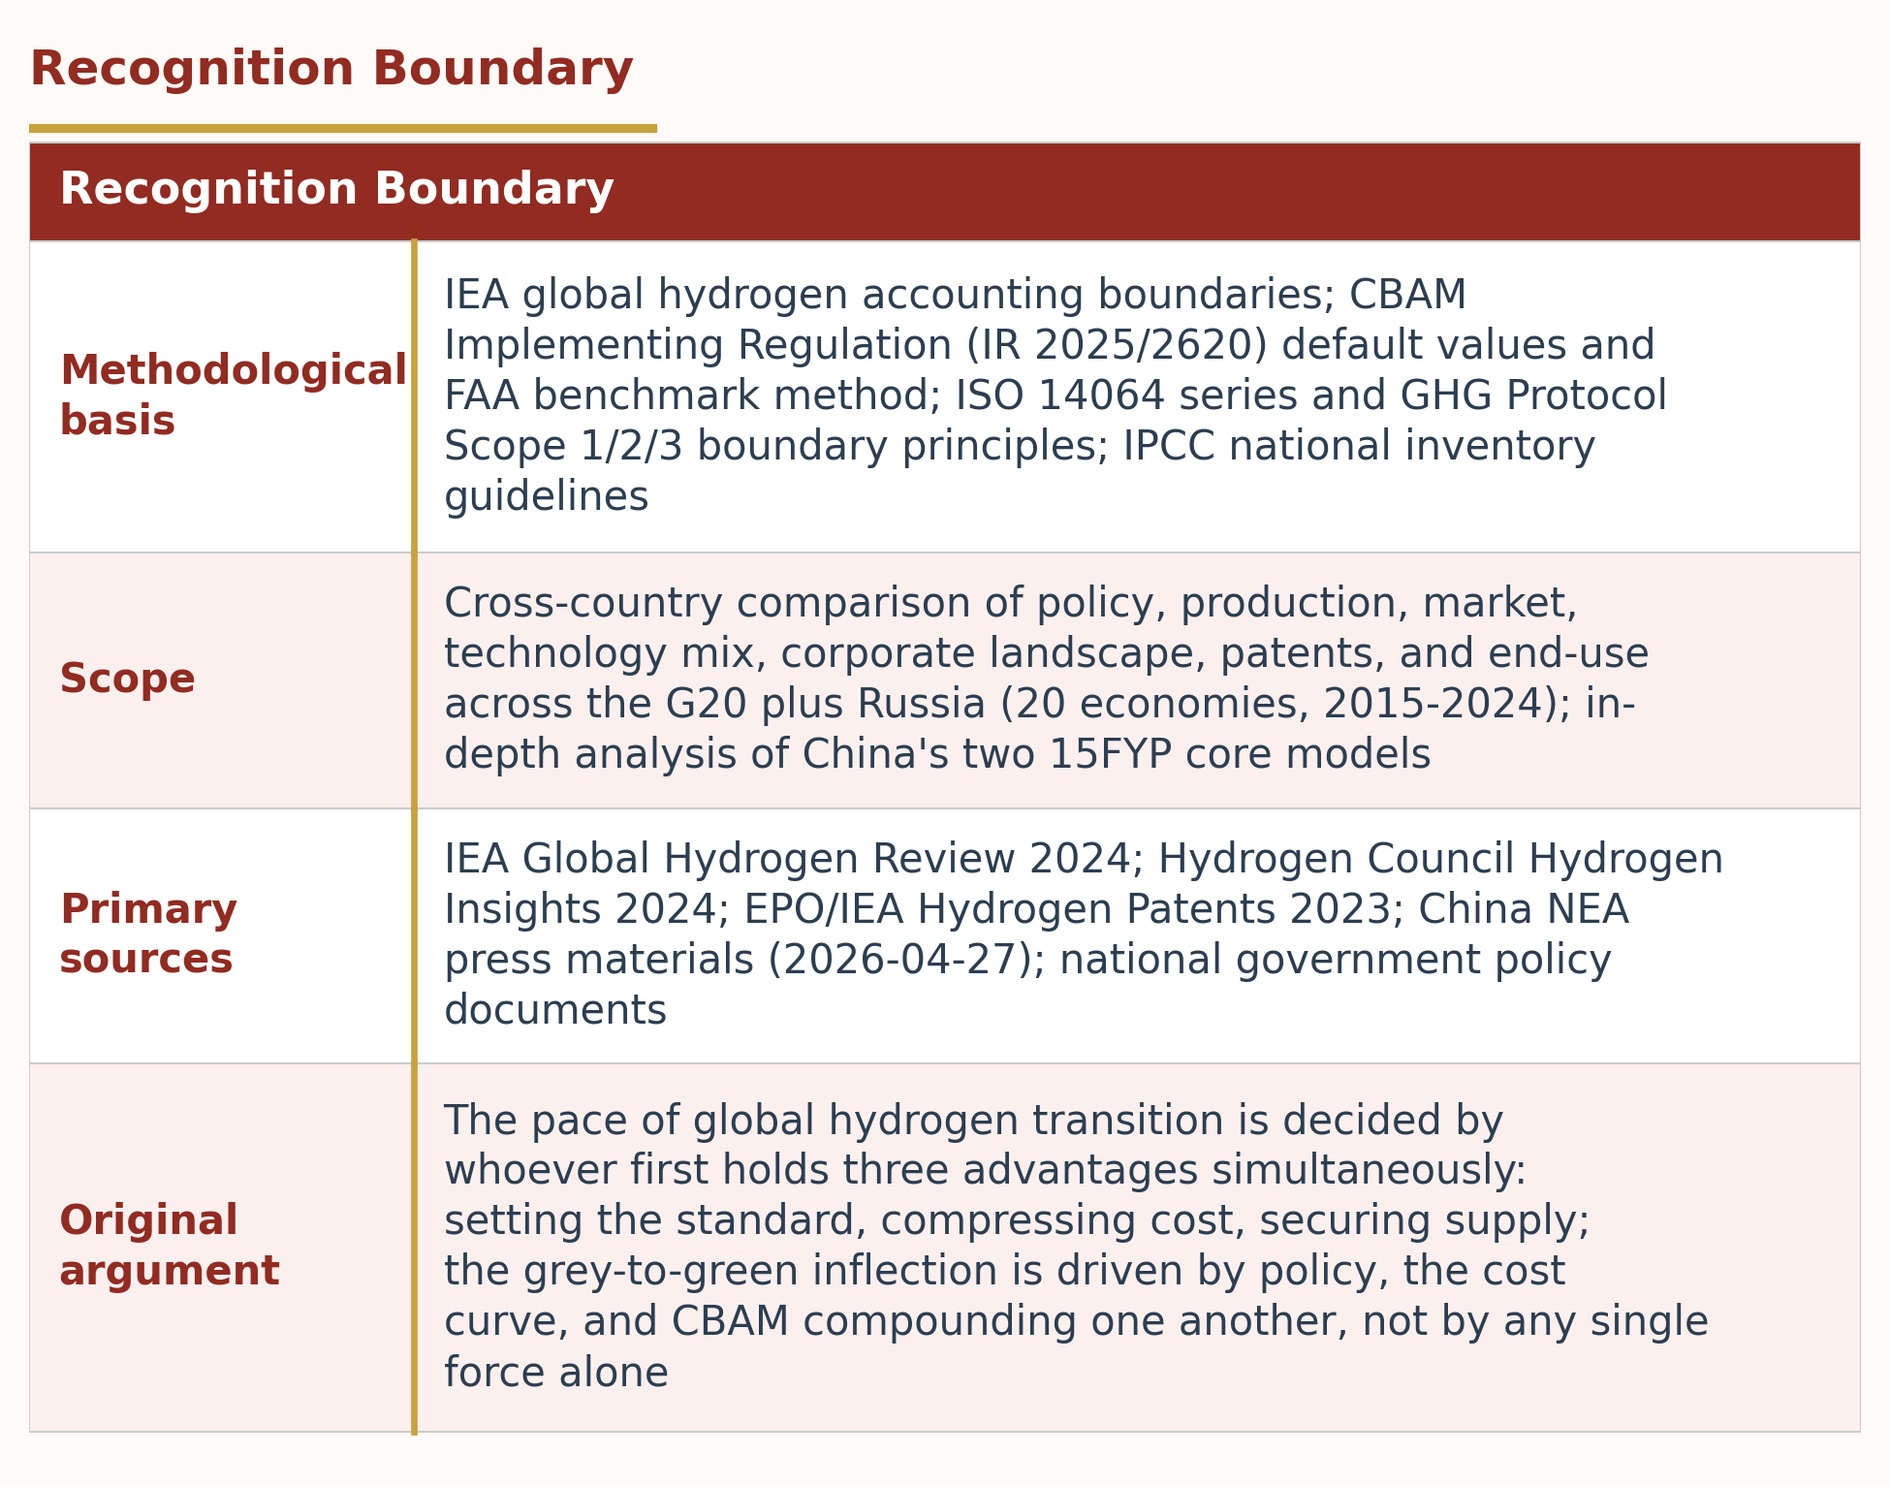
The pace of hydrogen transition will be decided by whoever first holds three positions simultaneously: setting the standard (the EU's CBAM and RED III), compressing cost (China's electrolyzer manufacturing), and securing supply (Japan, South Korea, and Australia's import-chain buildout). No one holds all three yet — which means the competitive landscape is still wide open.
China’s 15th Five-Year Plan Deep-Dive × G20 + Russia Comparative Analysis
I. Core Claim
Which player wins the global hydrogen contest depends on who first holds three advantages at once: setting the standard (the EU defining green-hydrogen eligibility through CBAM and RED III), compressing cost (China driving down green hydrogen prices through electrolyzer manufacturing scale), and securing supply (Japan, South Korea, and Australia building cross-border import chains). As of 2024 no single player holds all three, which means the global hydrogen landscape remains unsettled — and this is the yardstick against which this report compares 20 economies and China’s two core models.
II. Executive Summary & Scope
This report integrates two complementary research tracks. The first examines the hydrogen industry goals announced by China’s National Energy Administration (NEA) for the 15th Five-Year Plan (15FYP, 2026–2030), along with a deep-dive into the two core commercial models China is actively piloting. The second provides a systematic cross-country comparison across the G20 plus Russia: twenty major economies: covering the decade from 2015 to 2024 across seven dimensions: policy frameworks, production volumes, market scale, production technology mix, corporate landscape, patent rankings, and end-use industries, with trend evolution illustrated through line charts.
Primary data sources: IEA Global Hydrogen Review 2024; Hydrogen Council Hydrogen Insights 2024; EPO/IEA Hydrogen Patents for a Clean Energy Future (2023); WIPO; national government policy documents.
III. Global Hydrogen Policy Landscape (2015–2025)
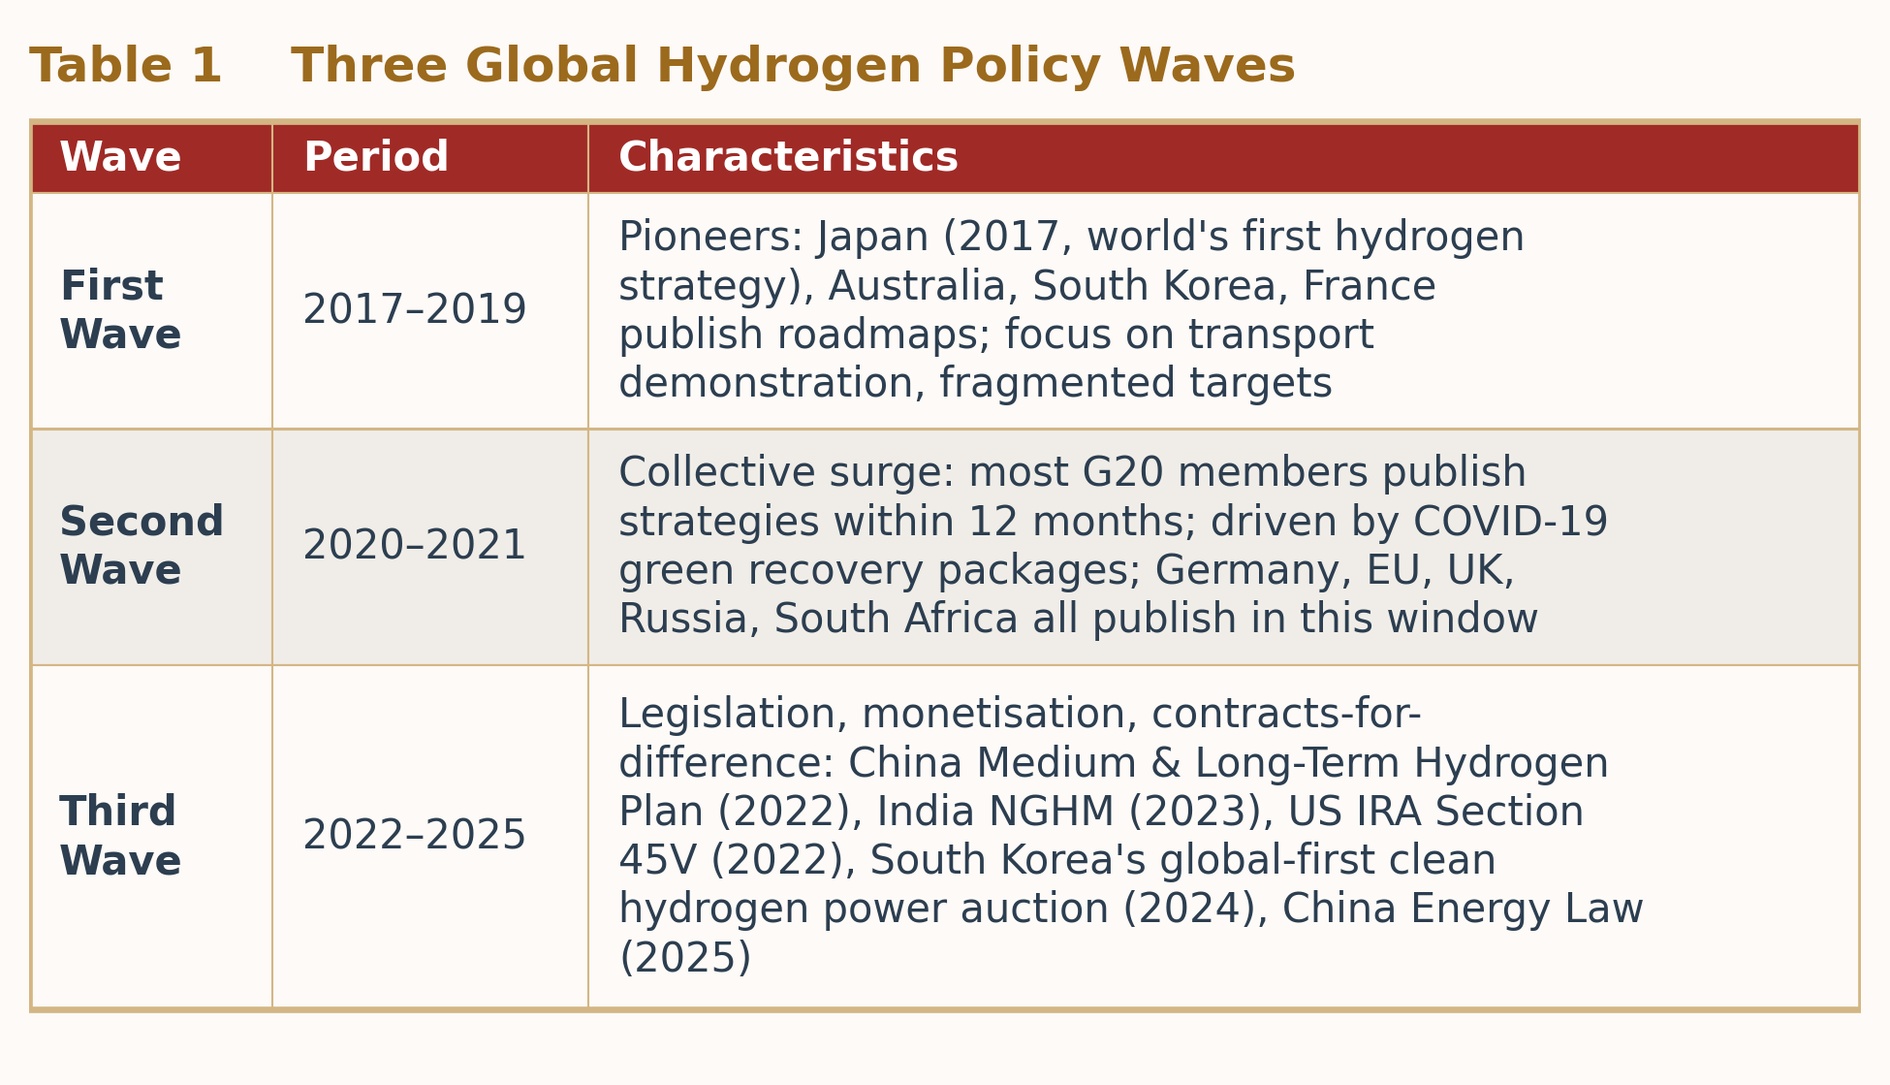
1. G20 + Russia: Three Policy Waves & Country Frameworks
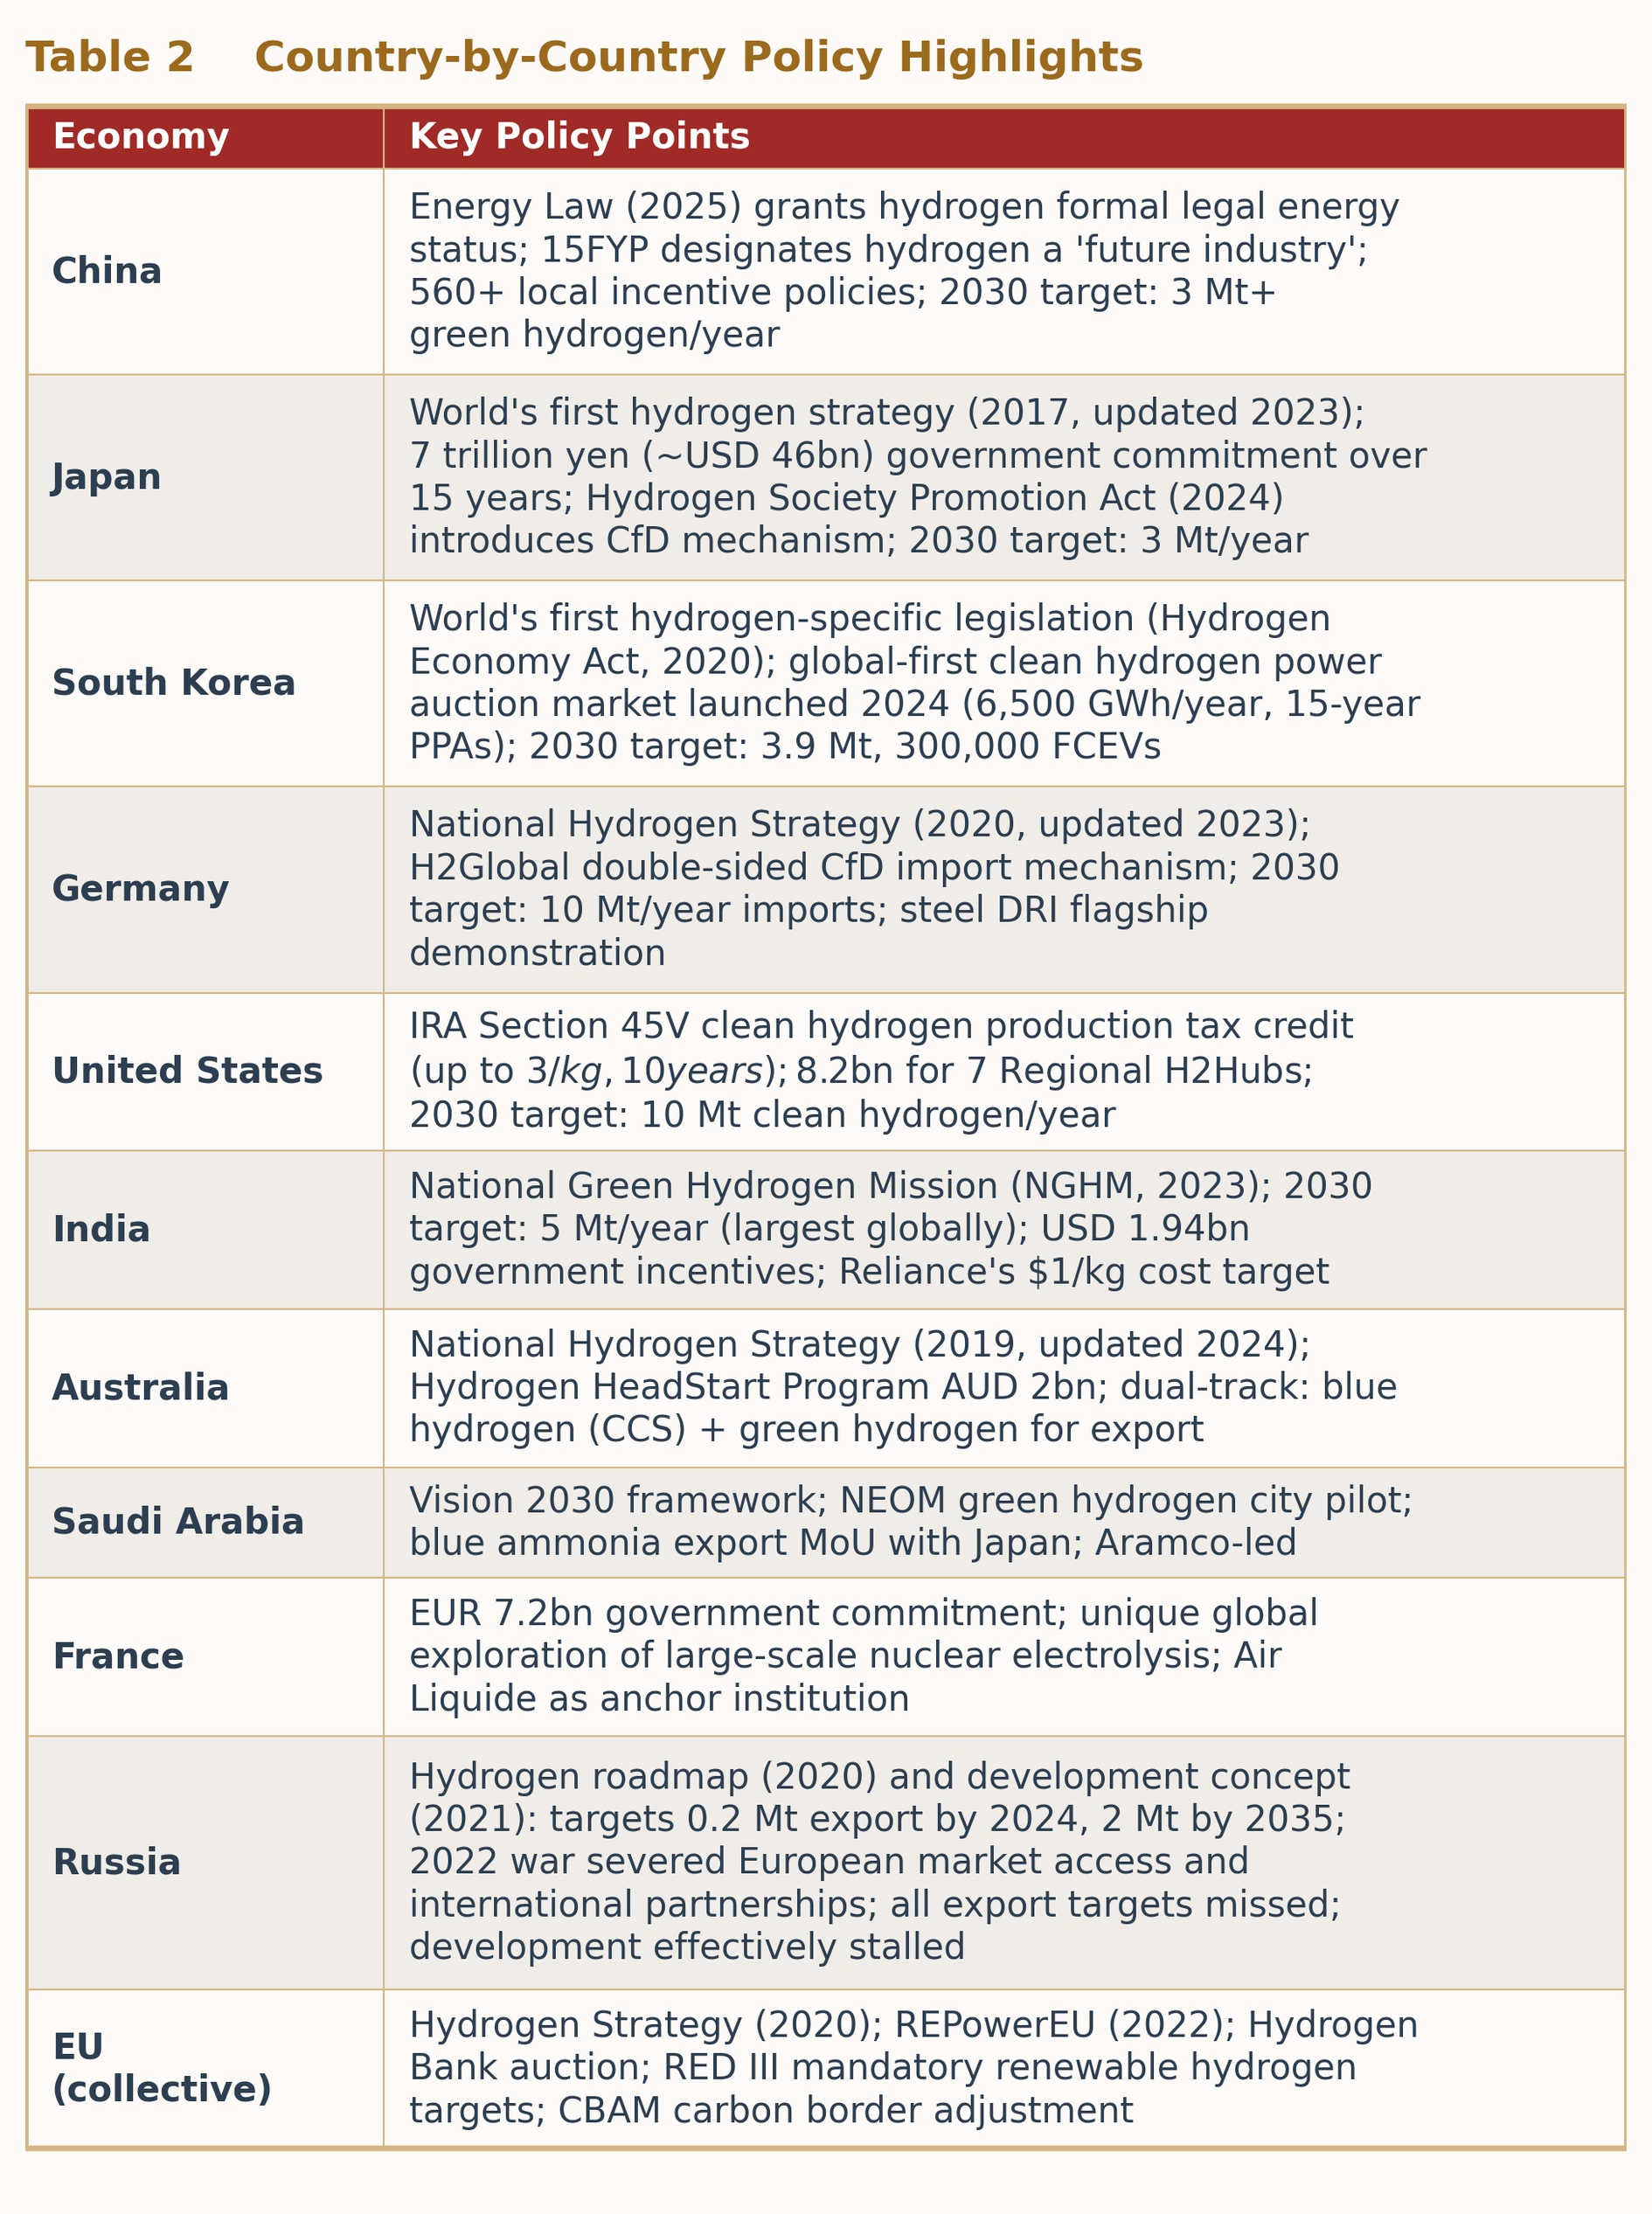
Country-by-Country Policy Highlights
2. China’s 15th Five-Year Plan: NEA Announcement & Five Strategic Priorities
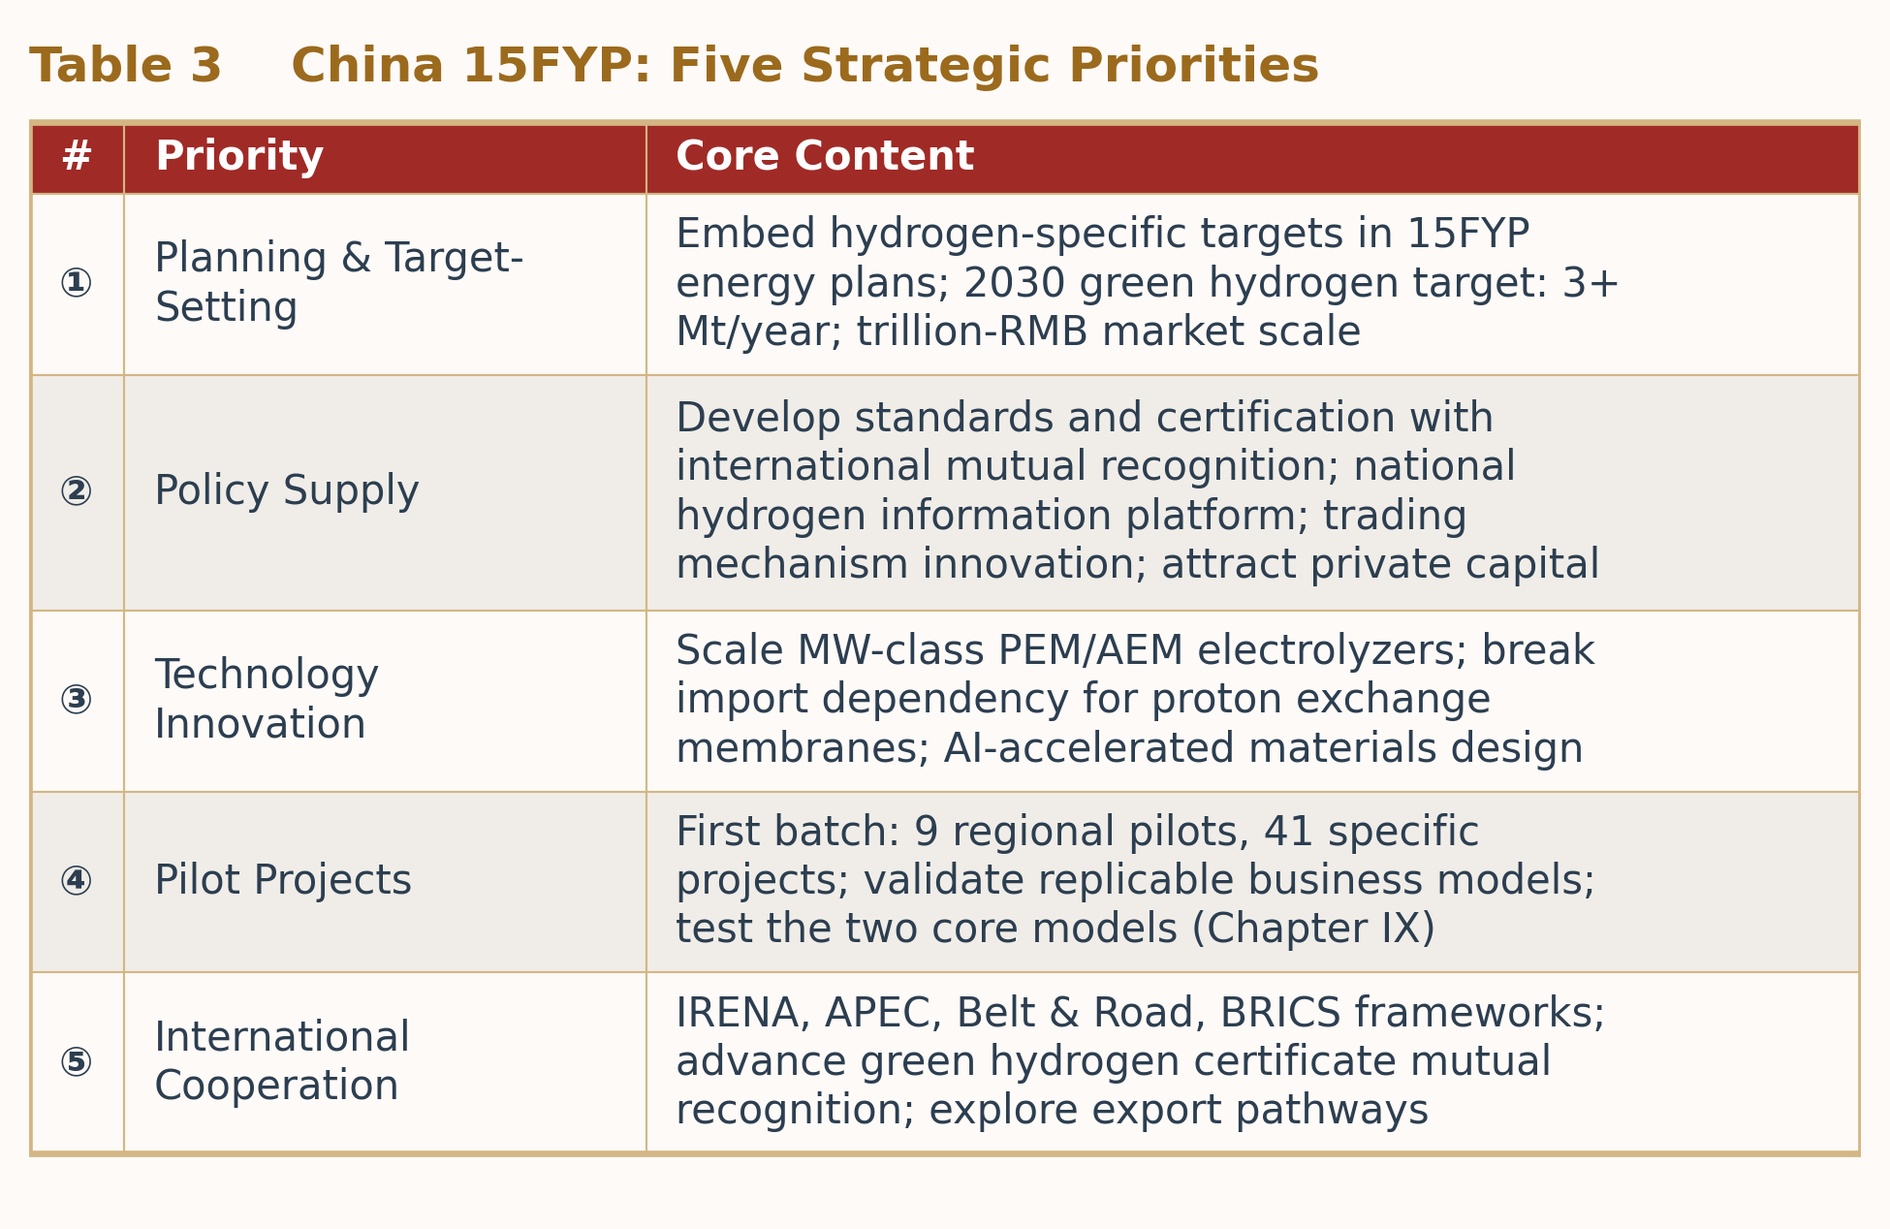
On 27 April 2026, NEA Deputy Director Bian Guangqi announced at the quarterly press briefing that the NEA would work with the NDRC to formulate hydrogen industry goals for the 15FYP (2026–2030). This follows two foundational developments: the Energy Law (January 2025), which granted hydrogen formal legal status as an energy source for the first time, and the 15FYP proposal (October 2025), which designated hydrogen a ‘future industry’ and introduced the goal of building an ‘energy-strong nation’.
IV. Production Volumes & Market Scale
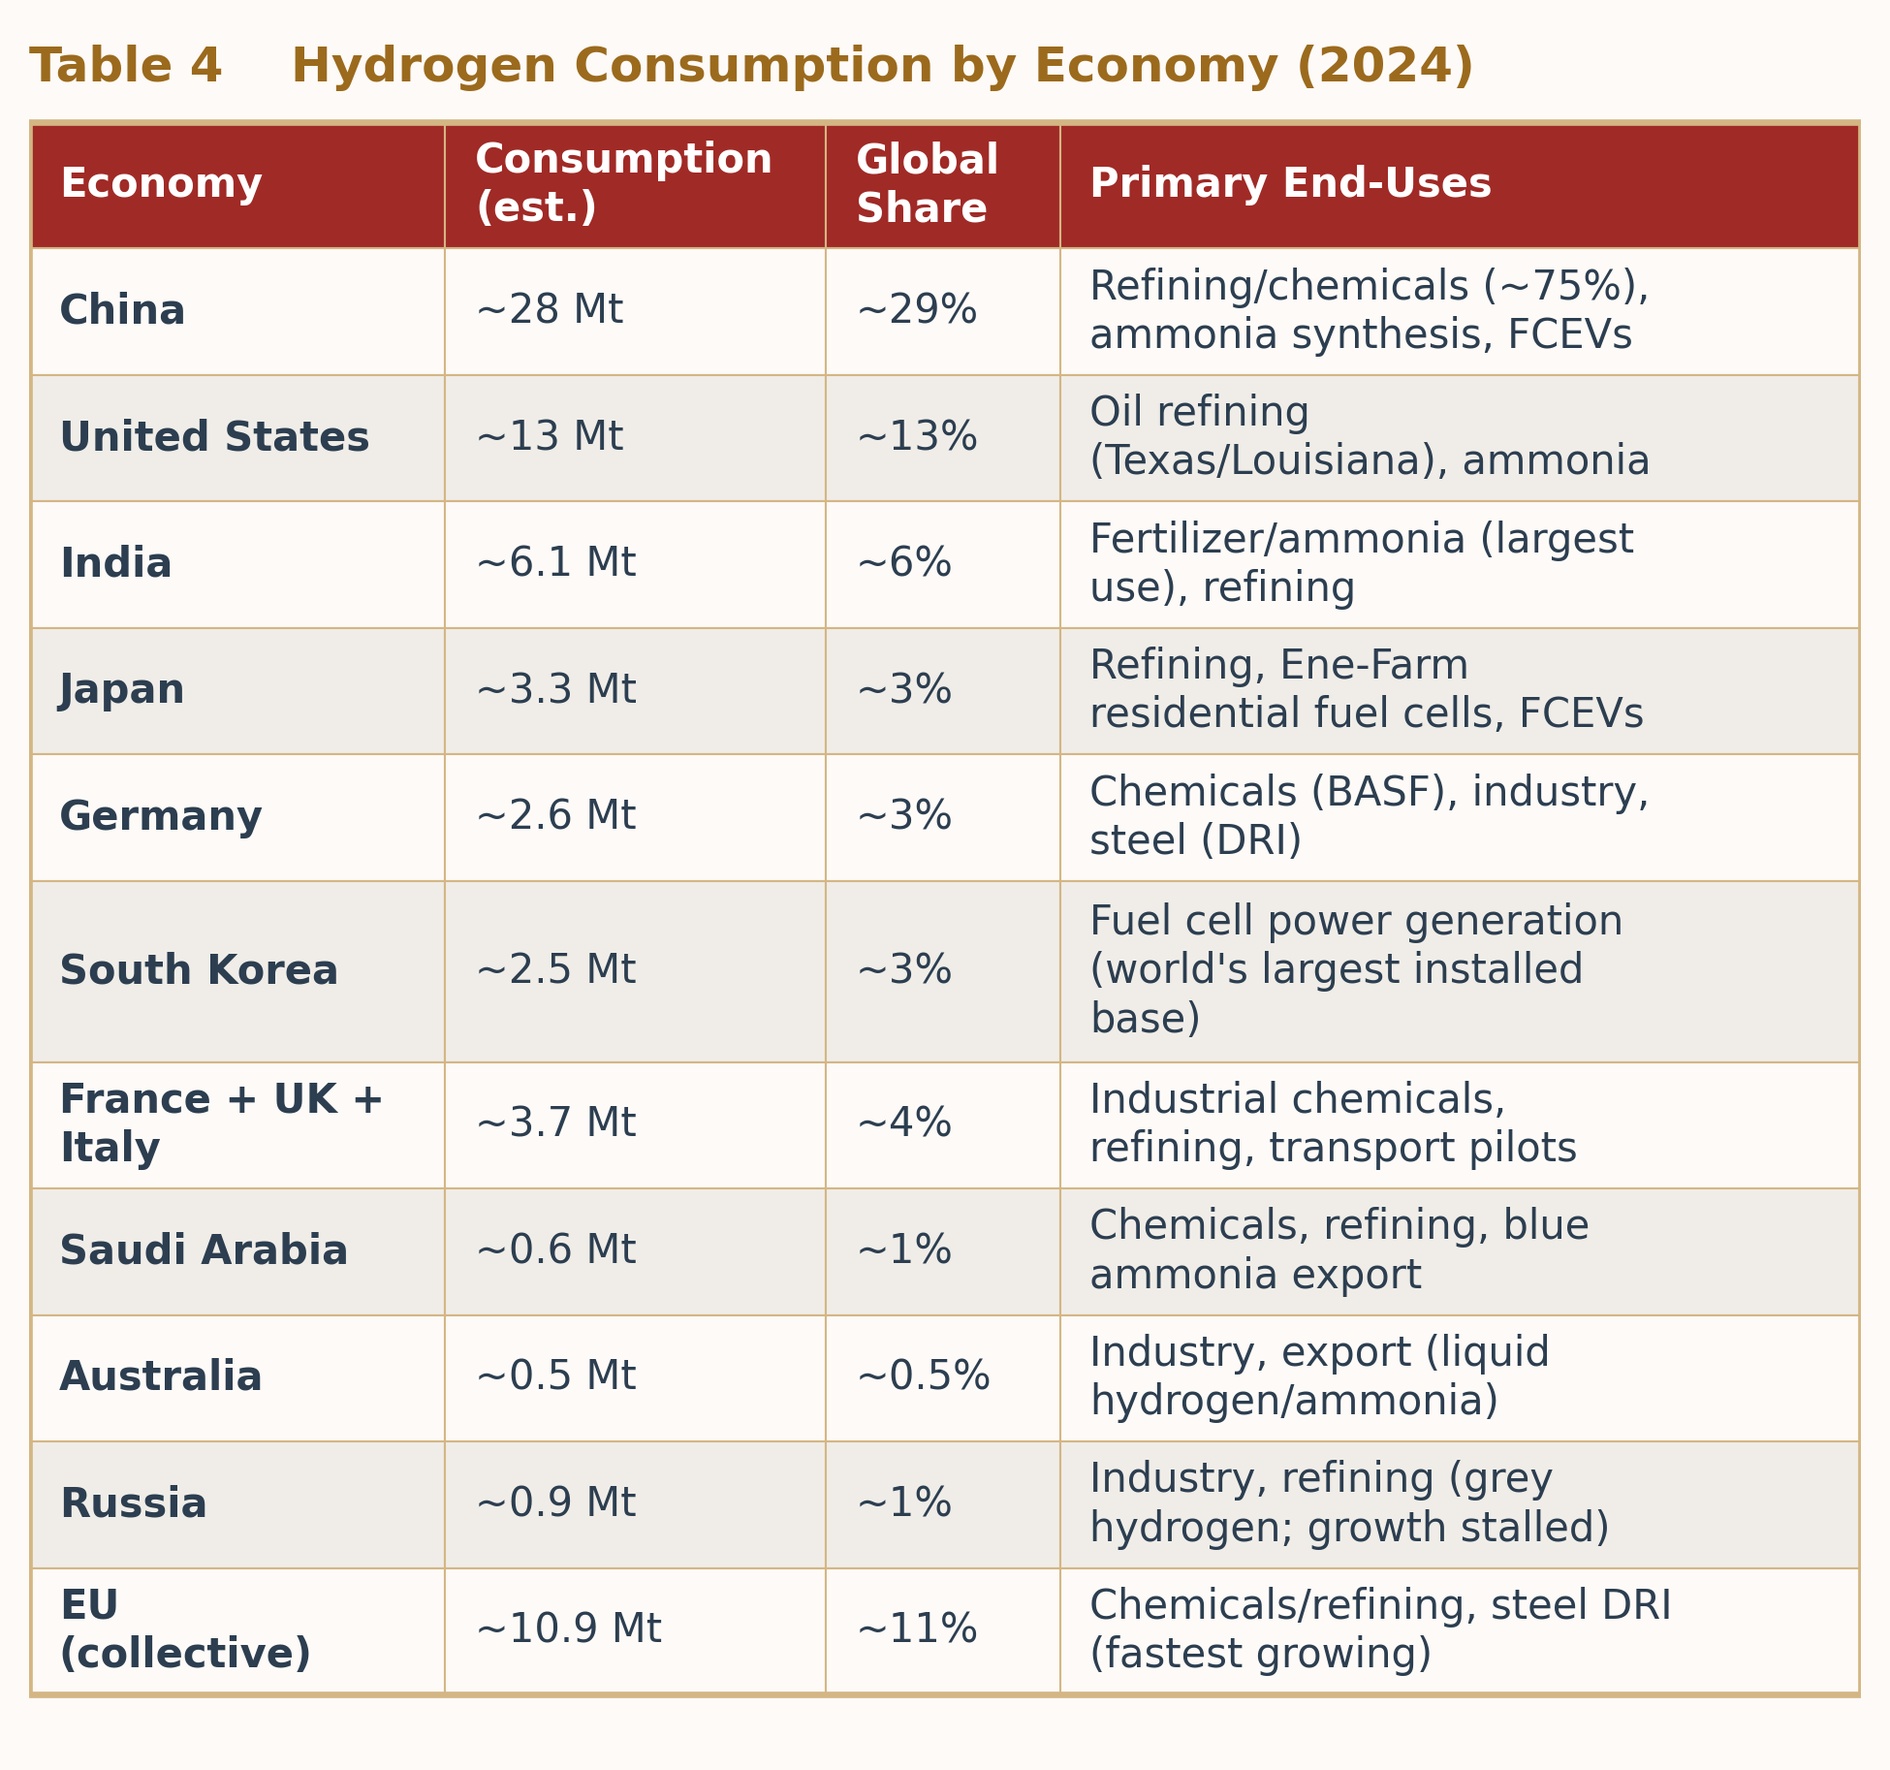
1. Hydrogen Consumption by Economy (2024 Estimates)
2. Market Economic Scale (2024)
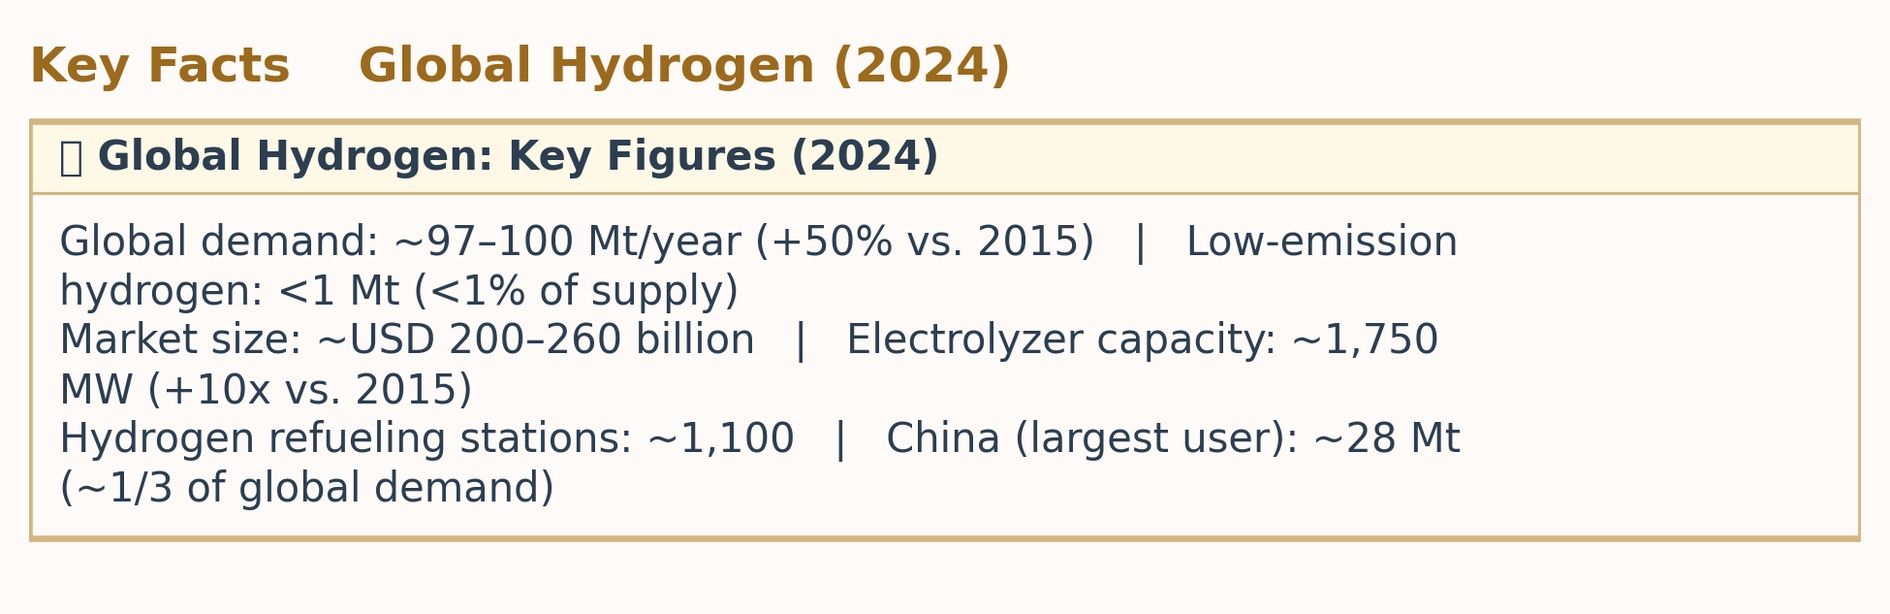
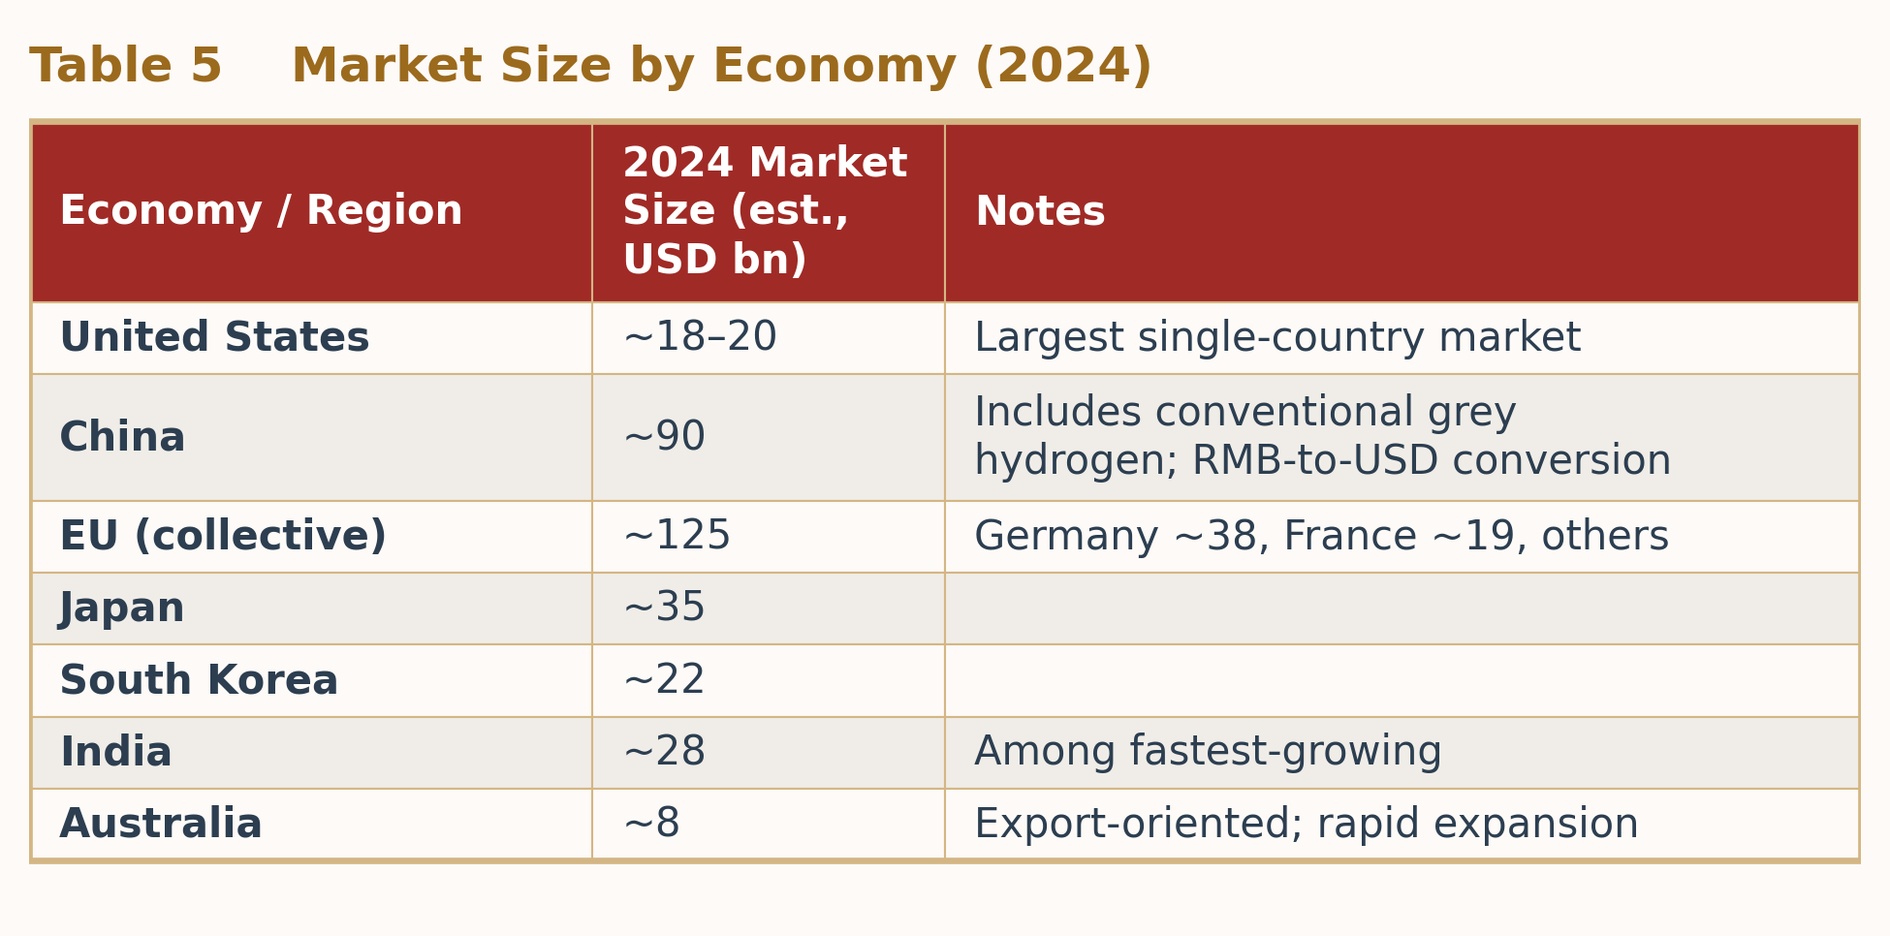
The global hydrogen market is estimated at approximately USD 200–260 billion in 2024, with Asia-Pacific accounting for ~35% (China-dominant). The market is projected to expand at a CAGR of 6–9%, reaching USD 400–550 billion by 2034–2035. The green hydrogen sub-market currently stands at ~USD 7–8 billion but is growing at ~39% CAGR.
V. Hydrogen Production Technology Mix & 10-Year Evolution
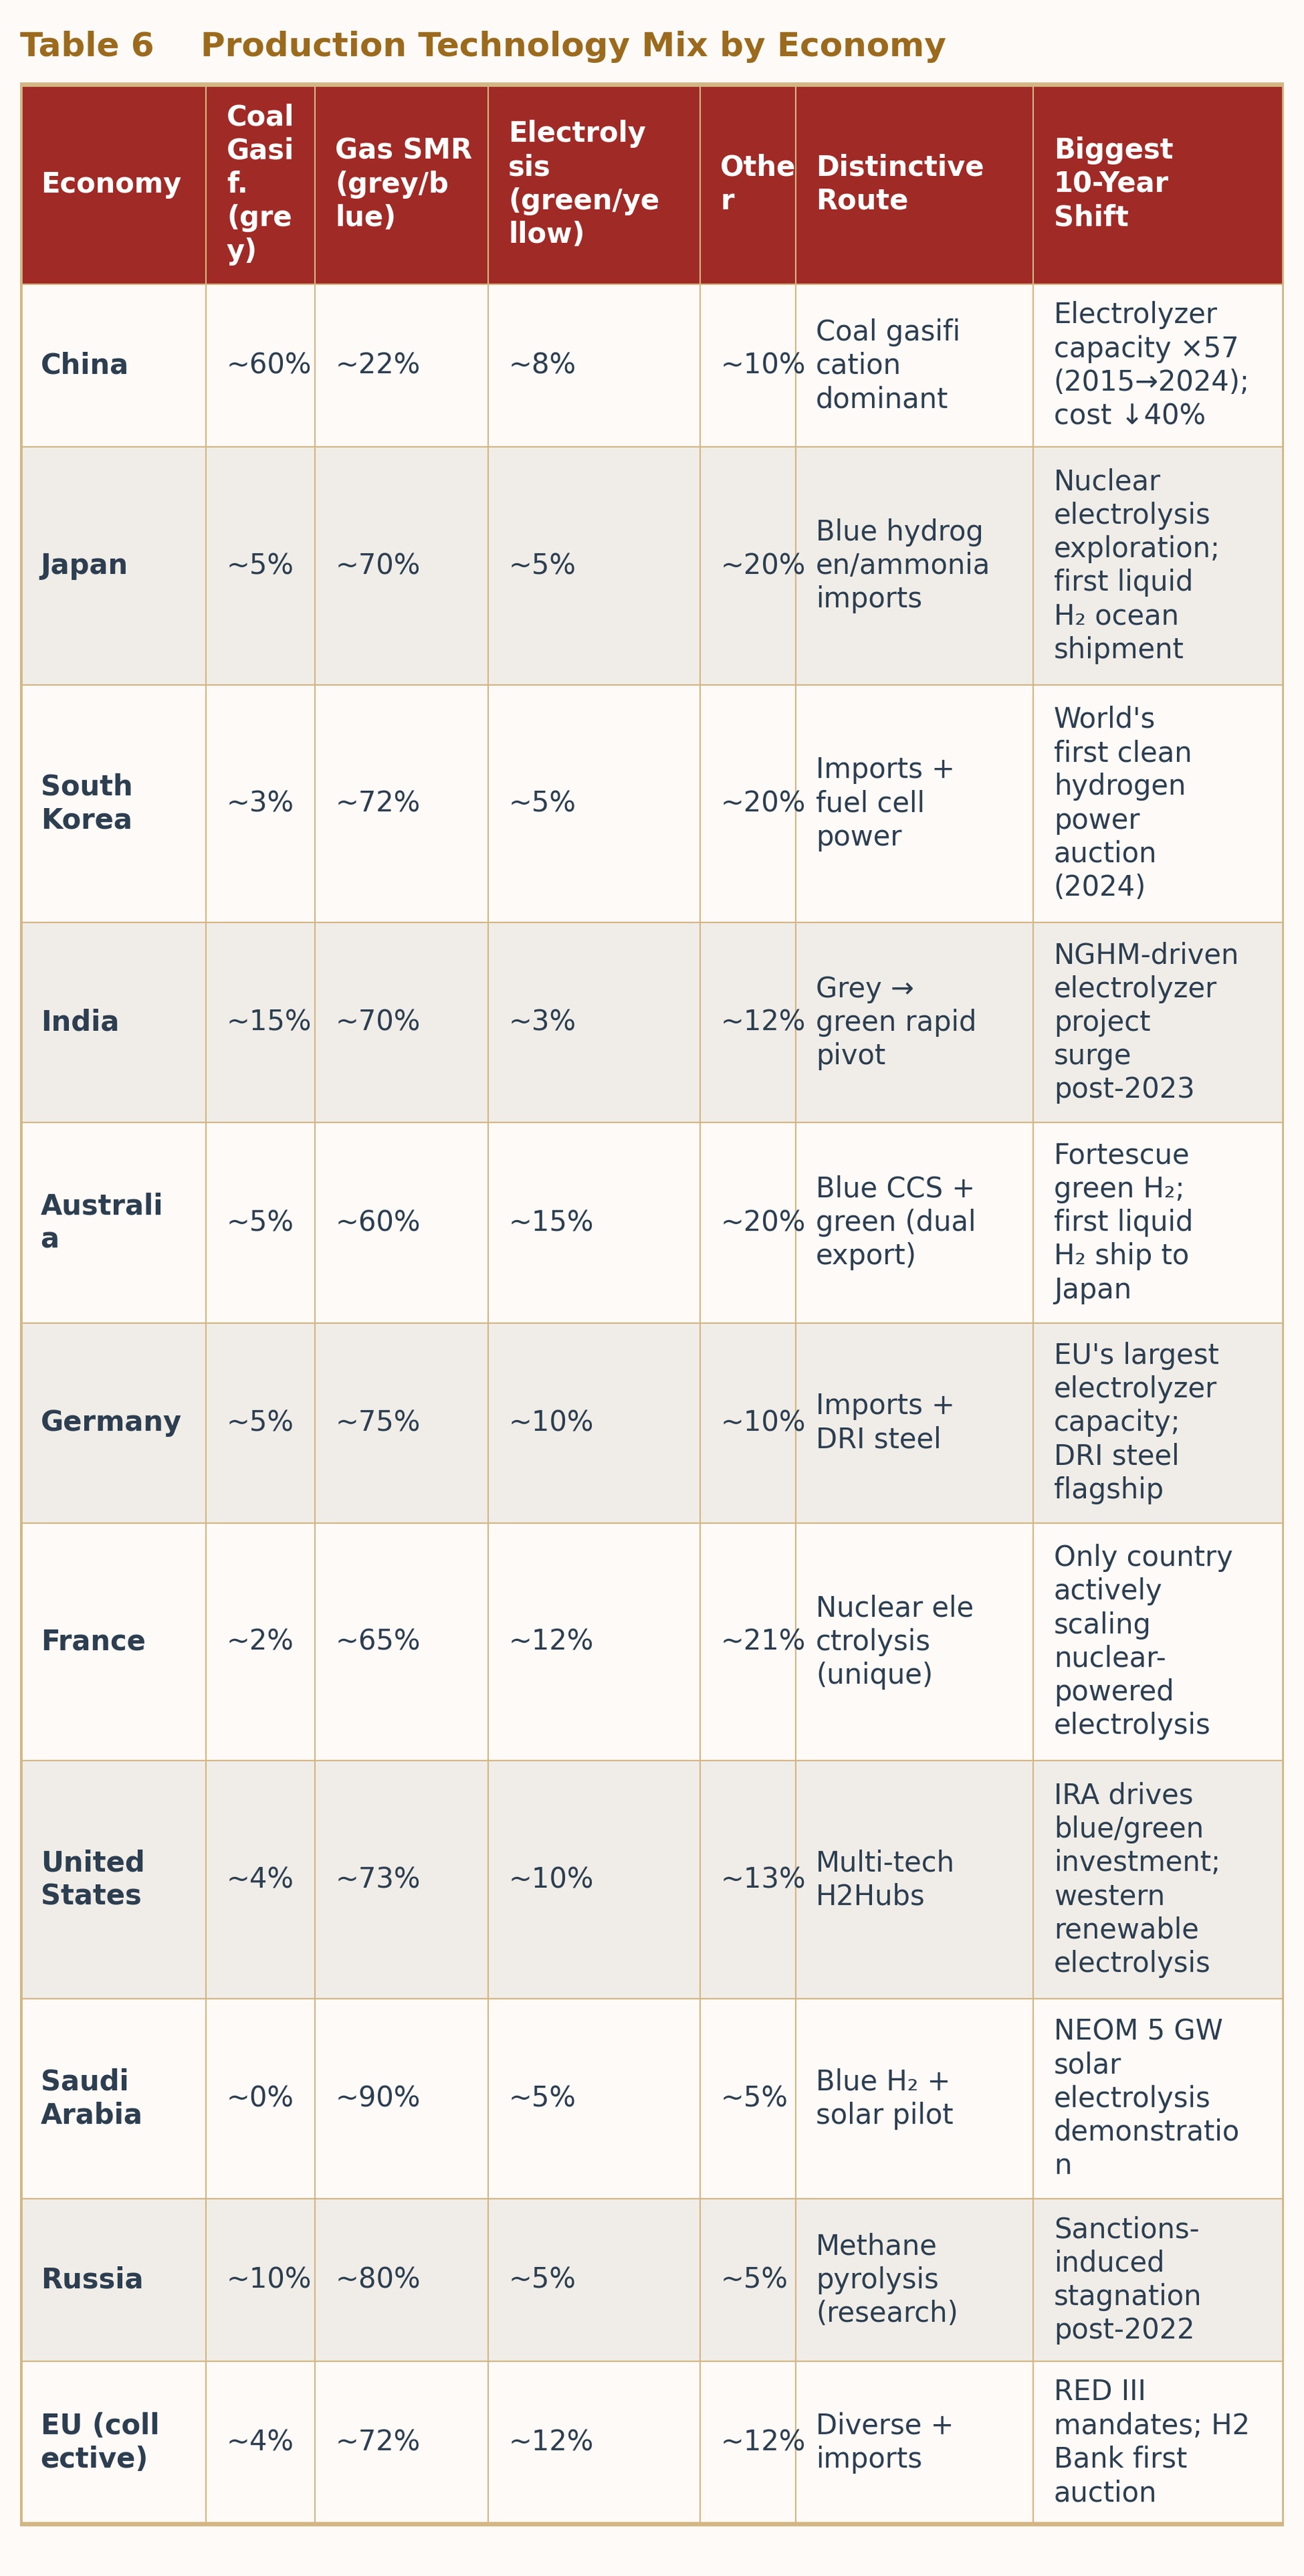
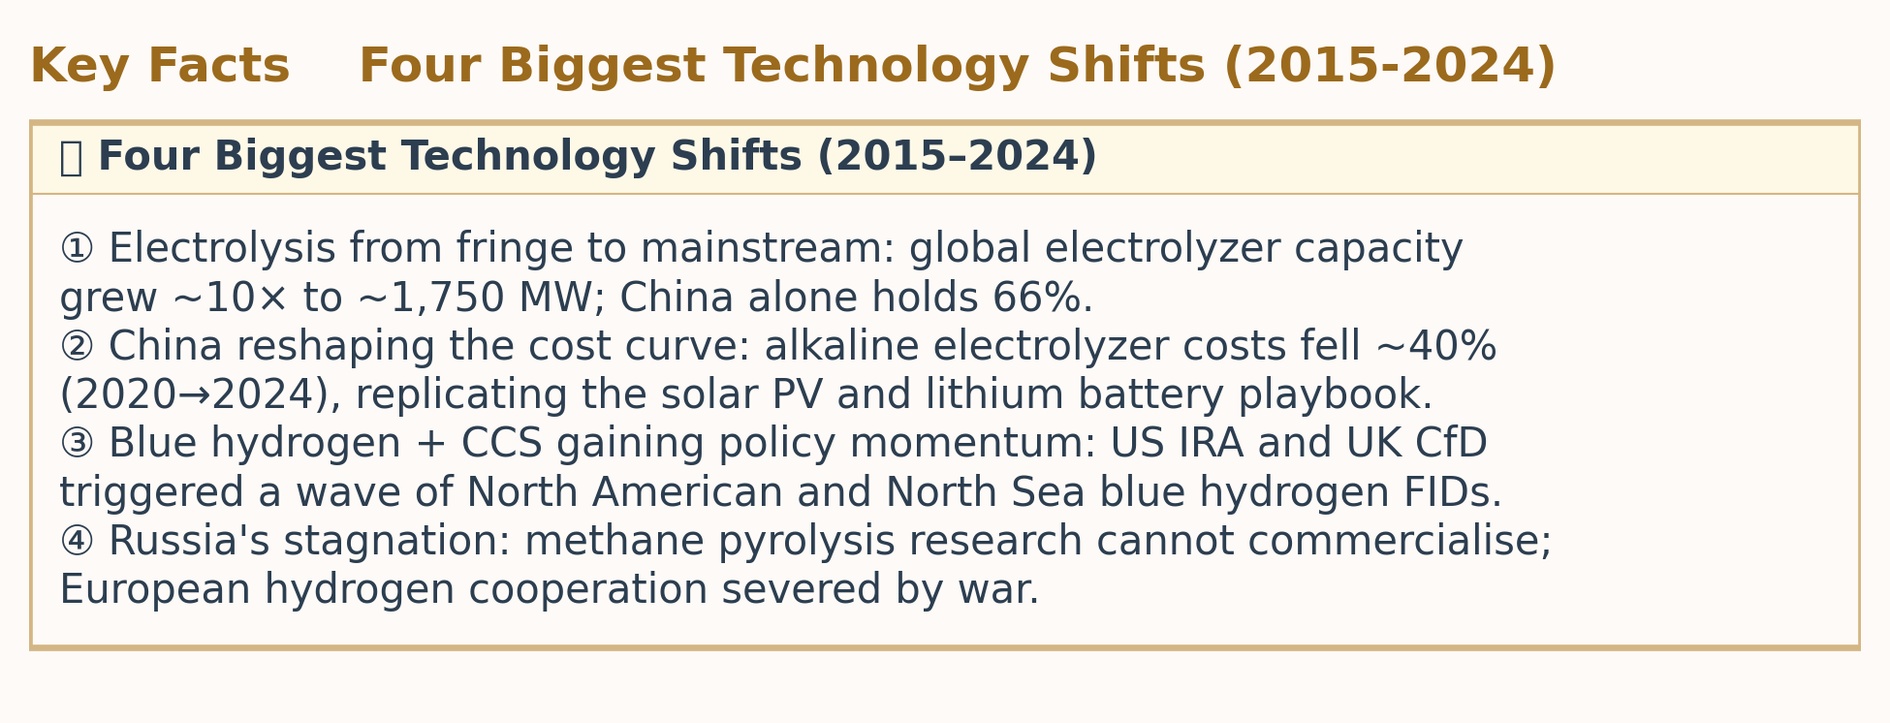
As of 2024, over 90% of global hydrogen production still derives from fossil fuels: natural gas steam methane reforming (SMR) ~48%, coal gasification ~19%, and oil-based by-products ~2%. Electrolysis accounts for under 3%, yet global electrolyzer installed capacity grew nearly 10-fold between 2015 and 2024.
VI. Key Industry Players: G20 + Russia
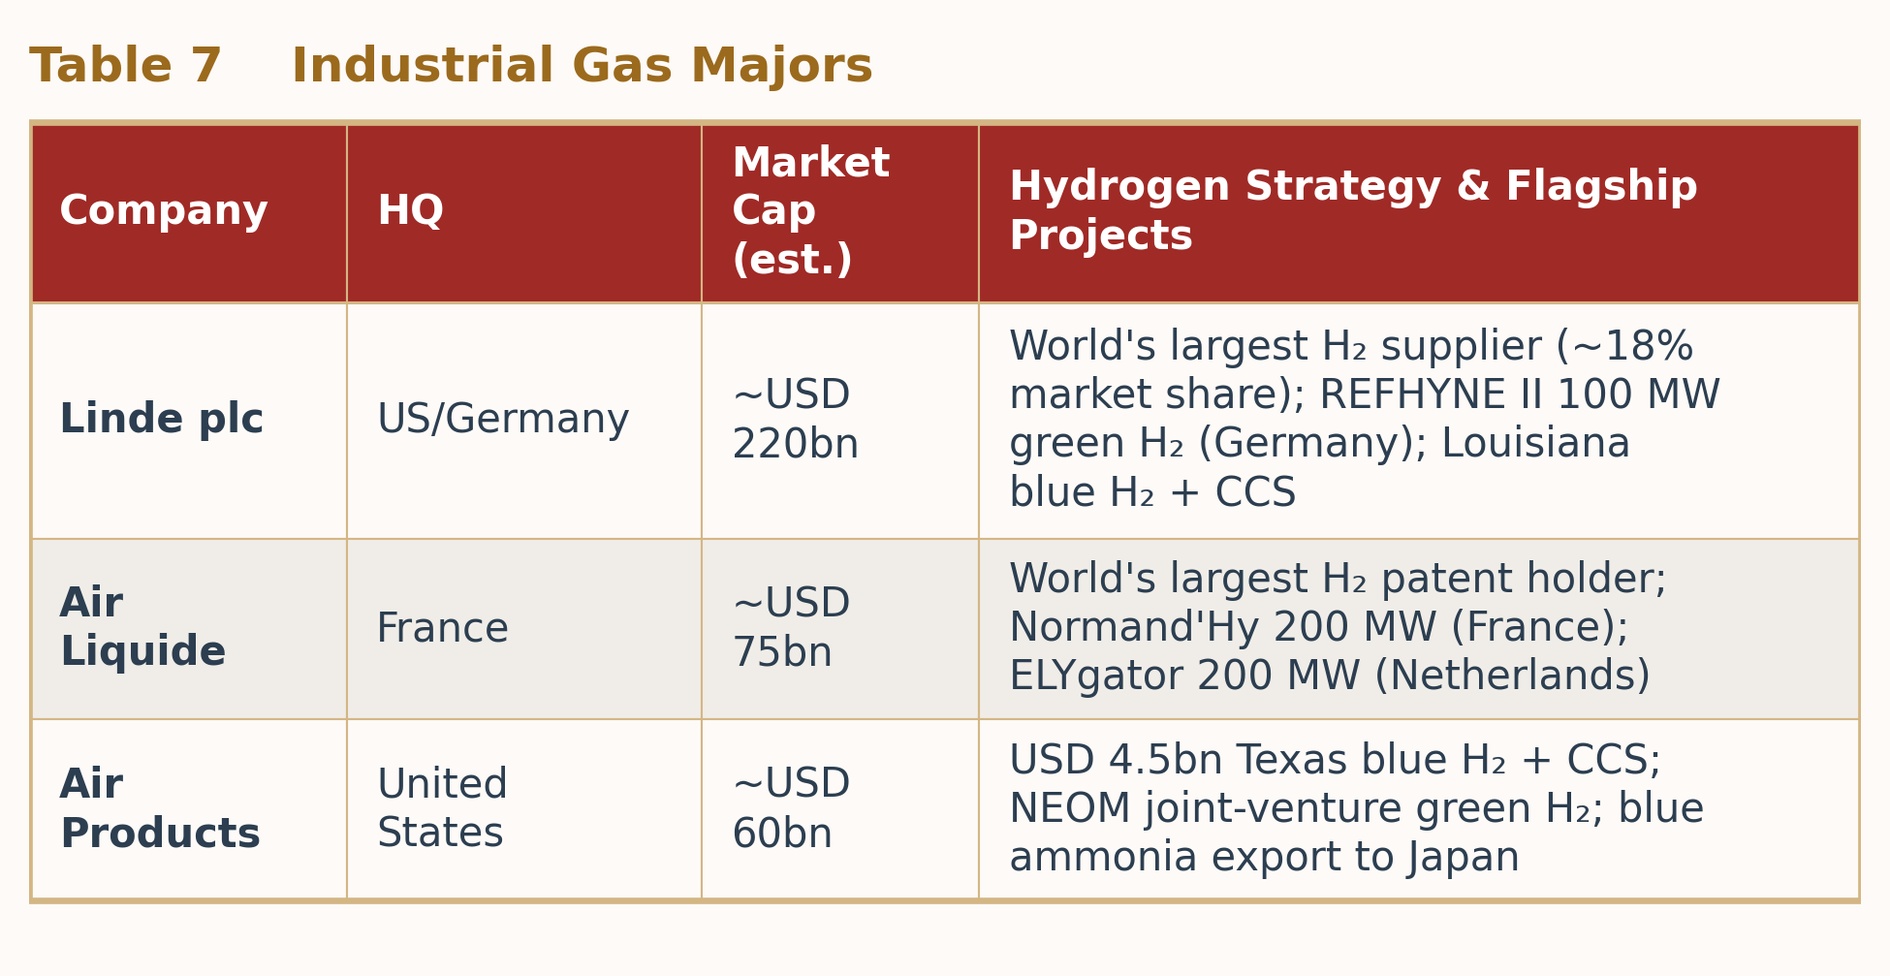
1. Industrial Gas Majors: Full-Value-Chain Integration
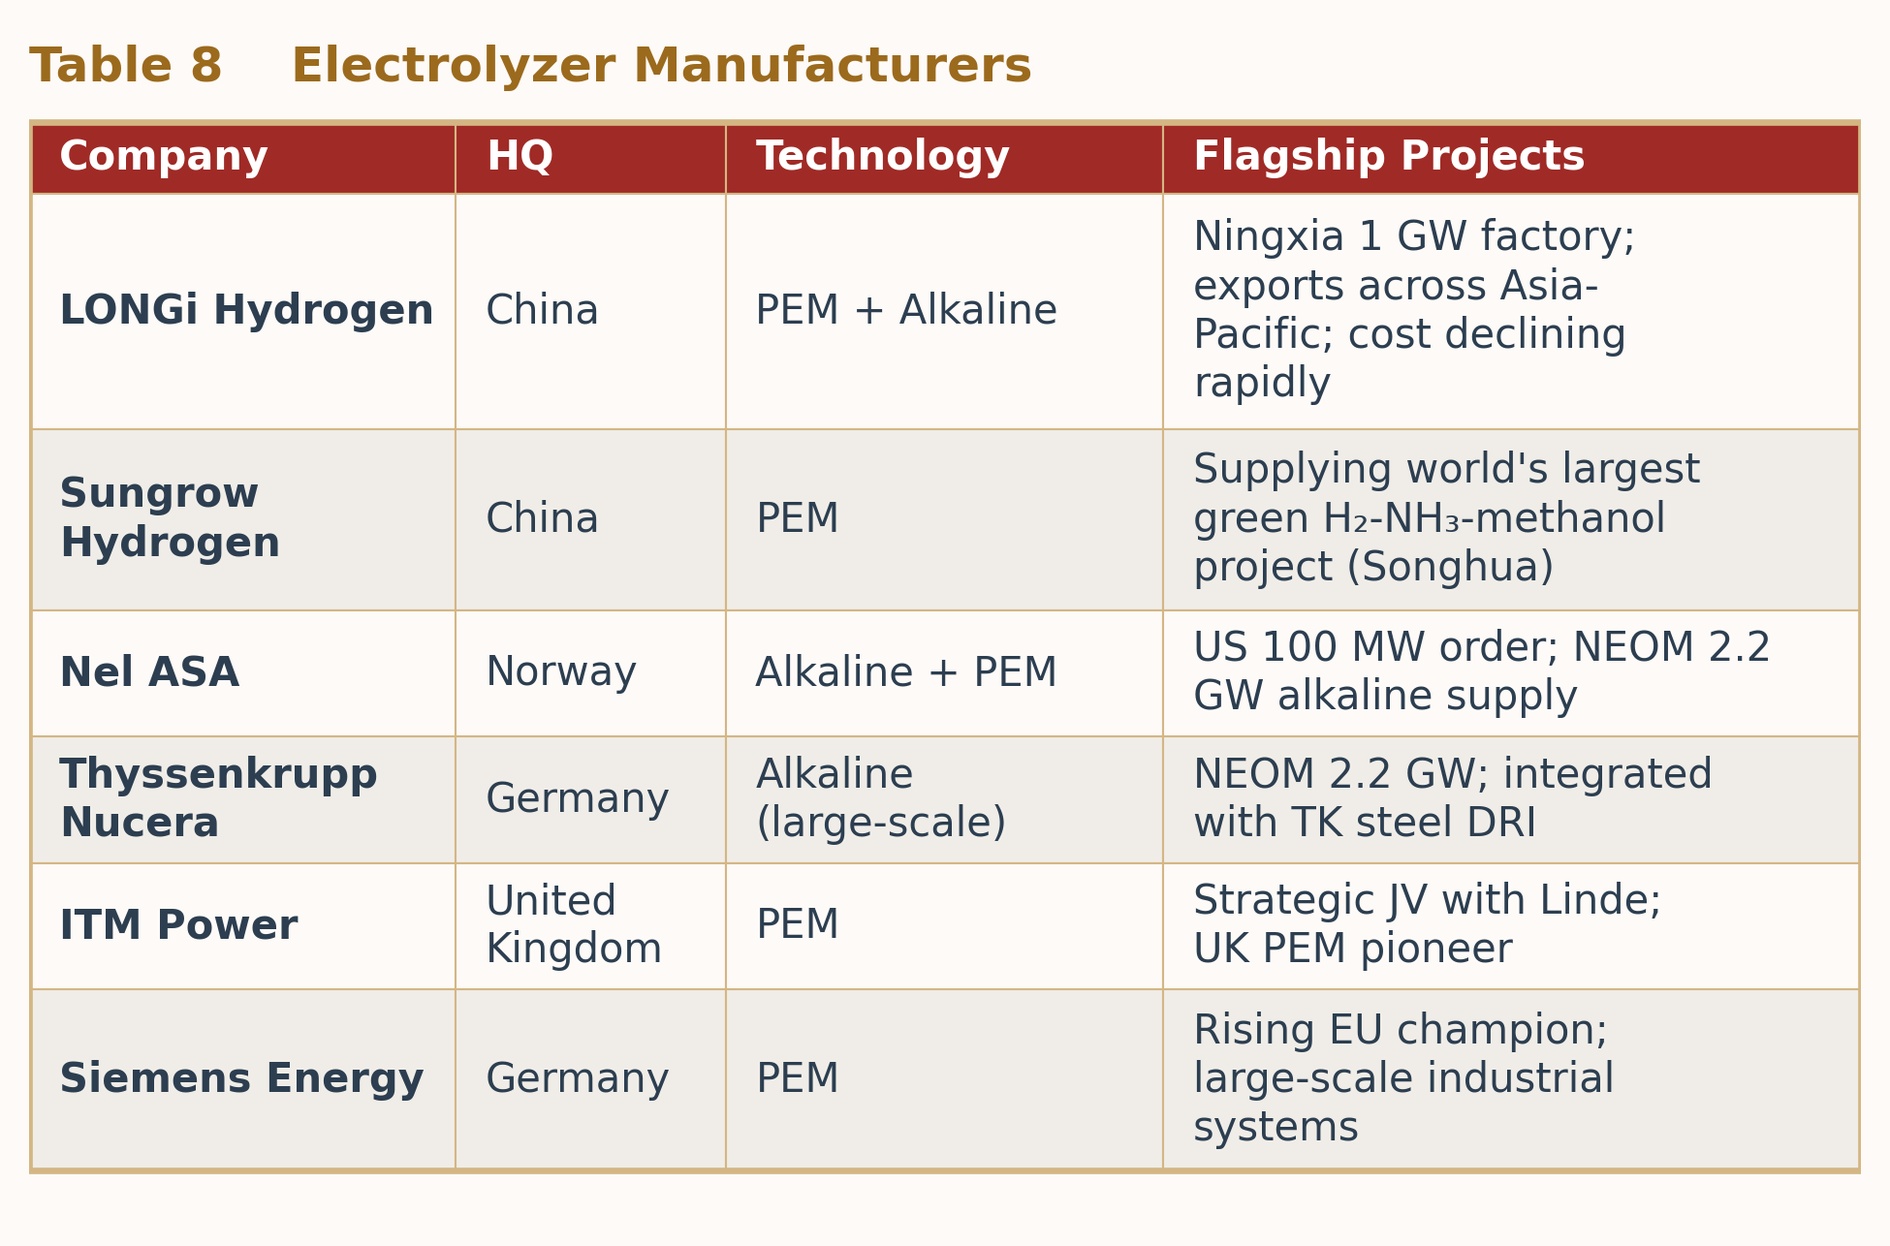
2. Electrolyzer Manufacturers: China Dominates, Europe Competes
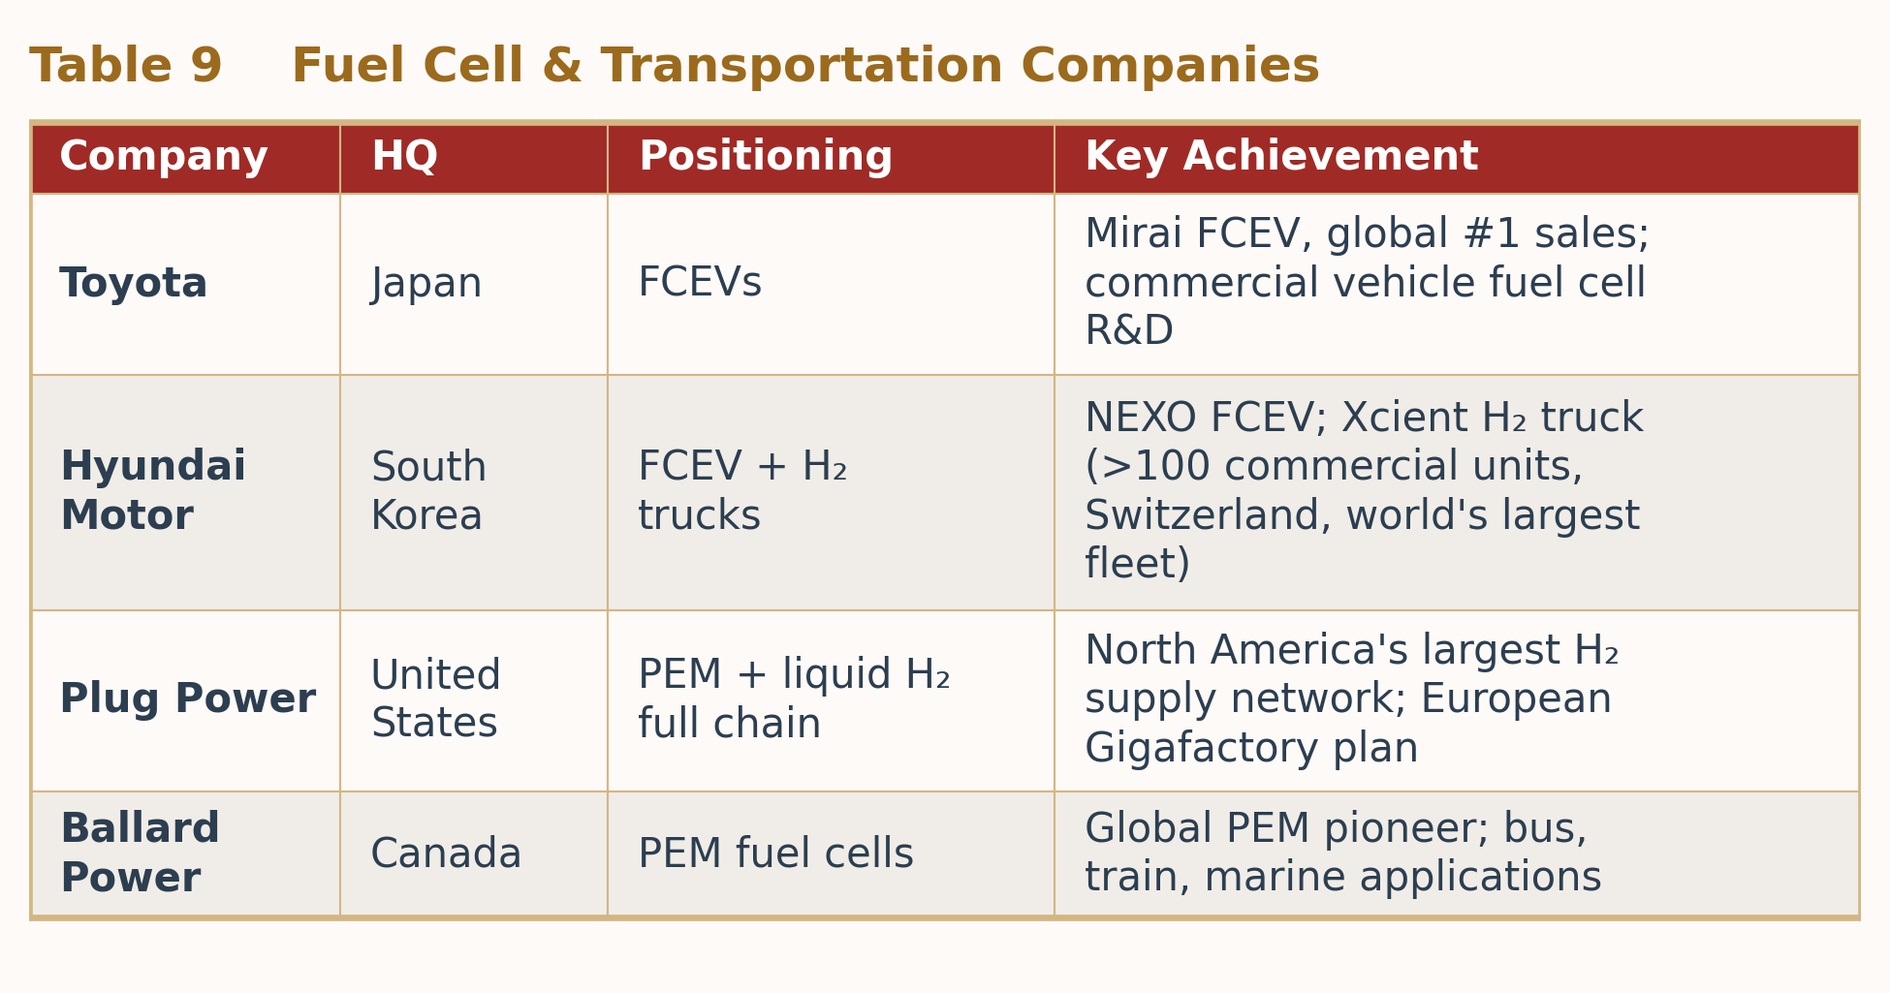
3. Fuel Cell & Transportation: Japan and South Korea Lead
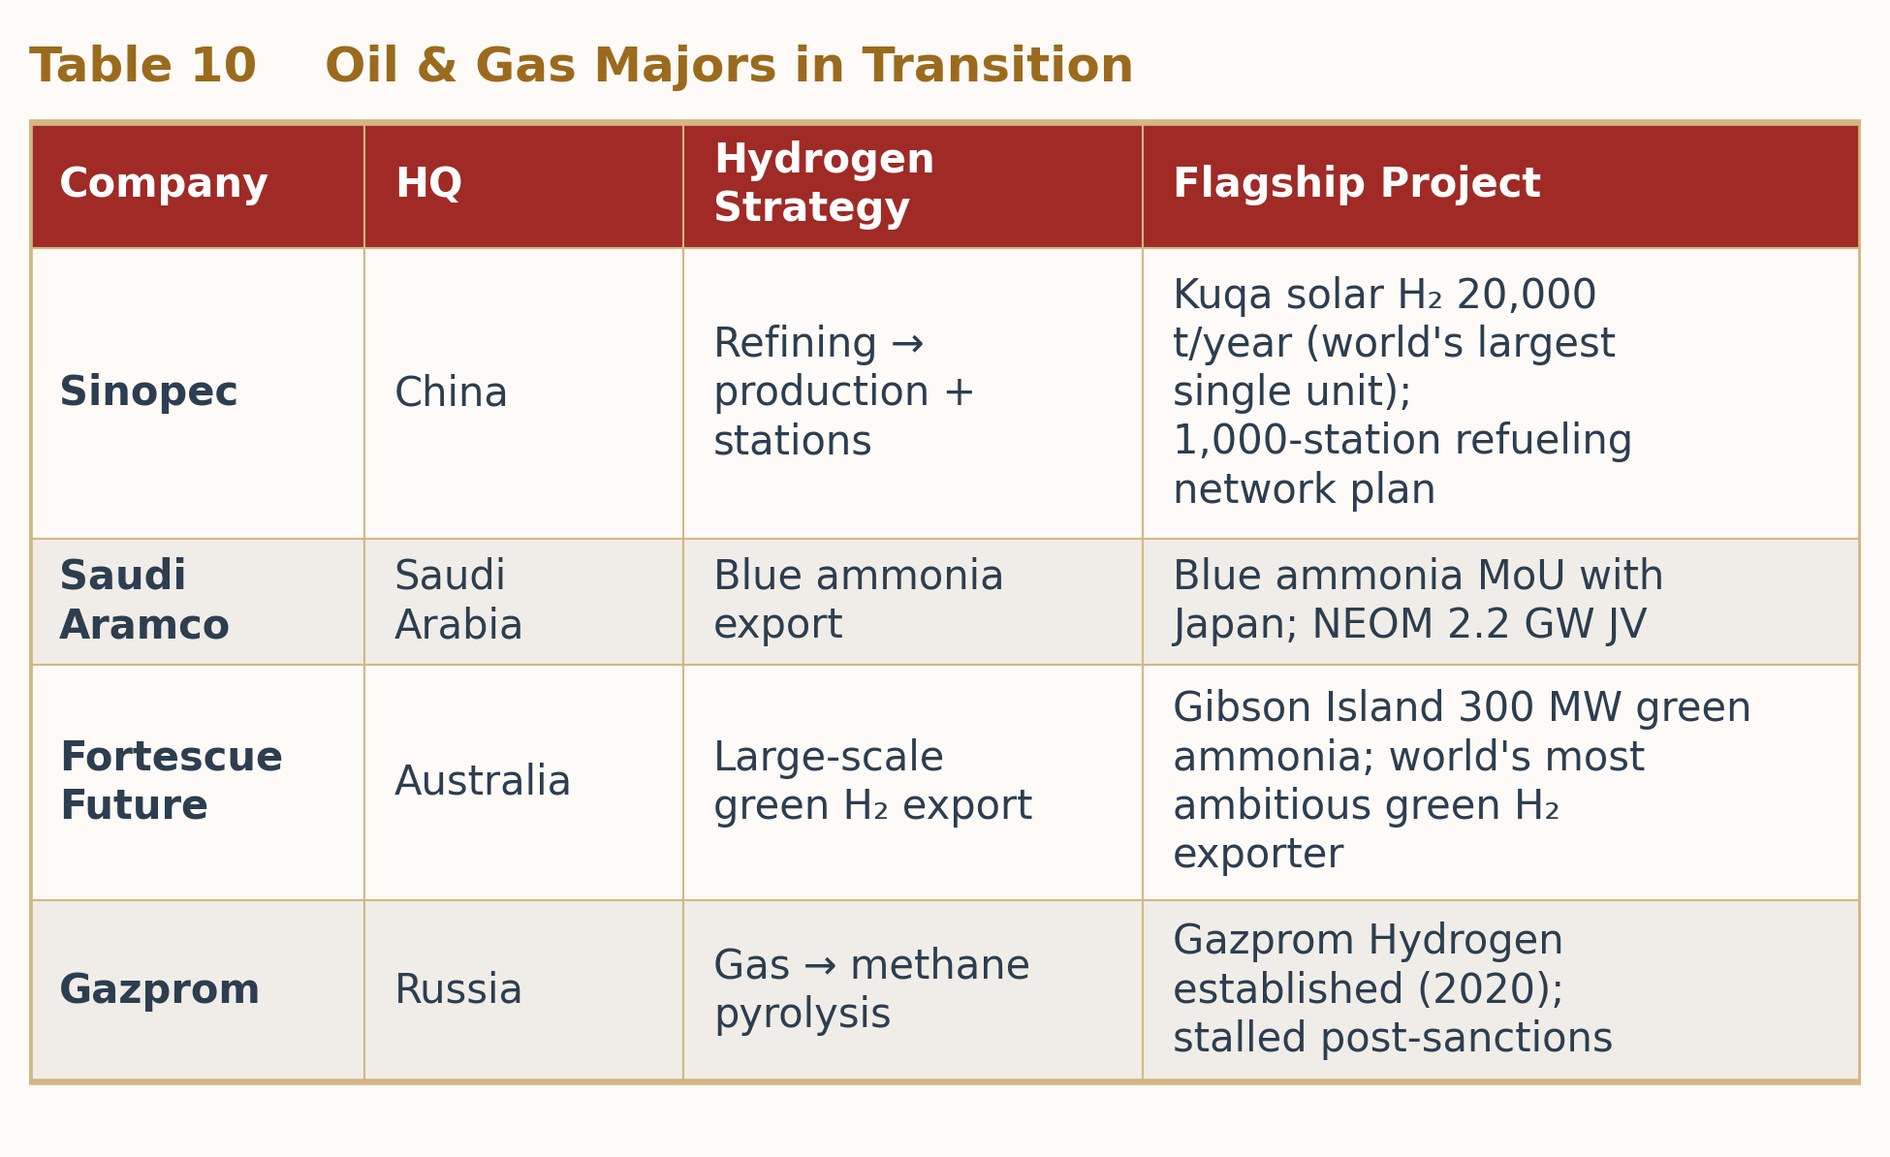
4. Oil & Gas Majors in Transition
VII. Hydrogen Technology Patent Rankings
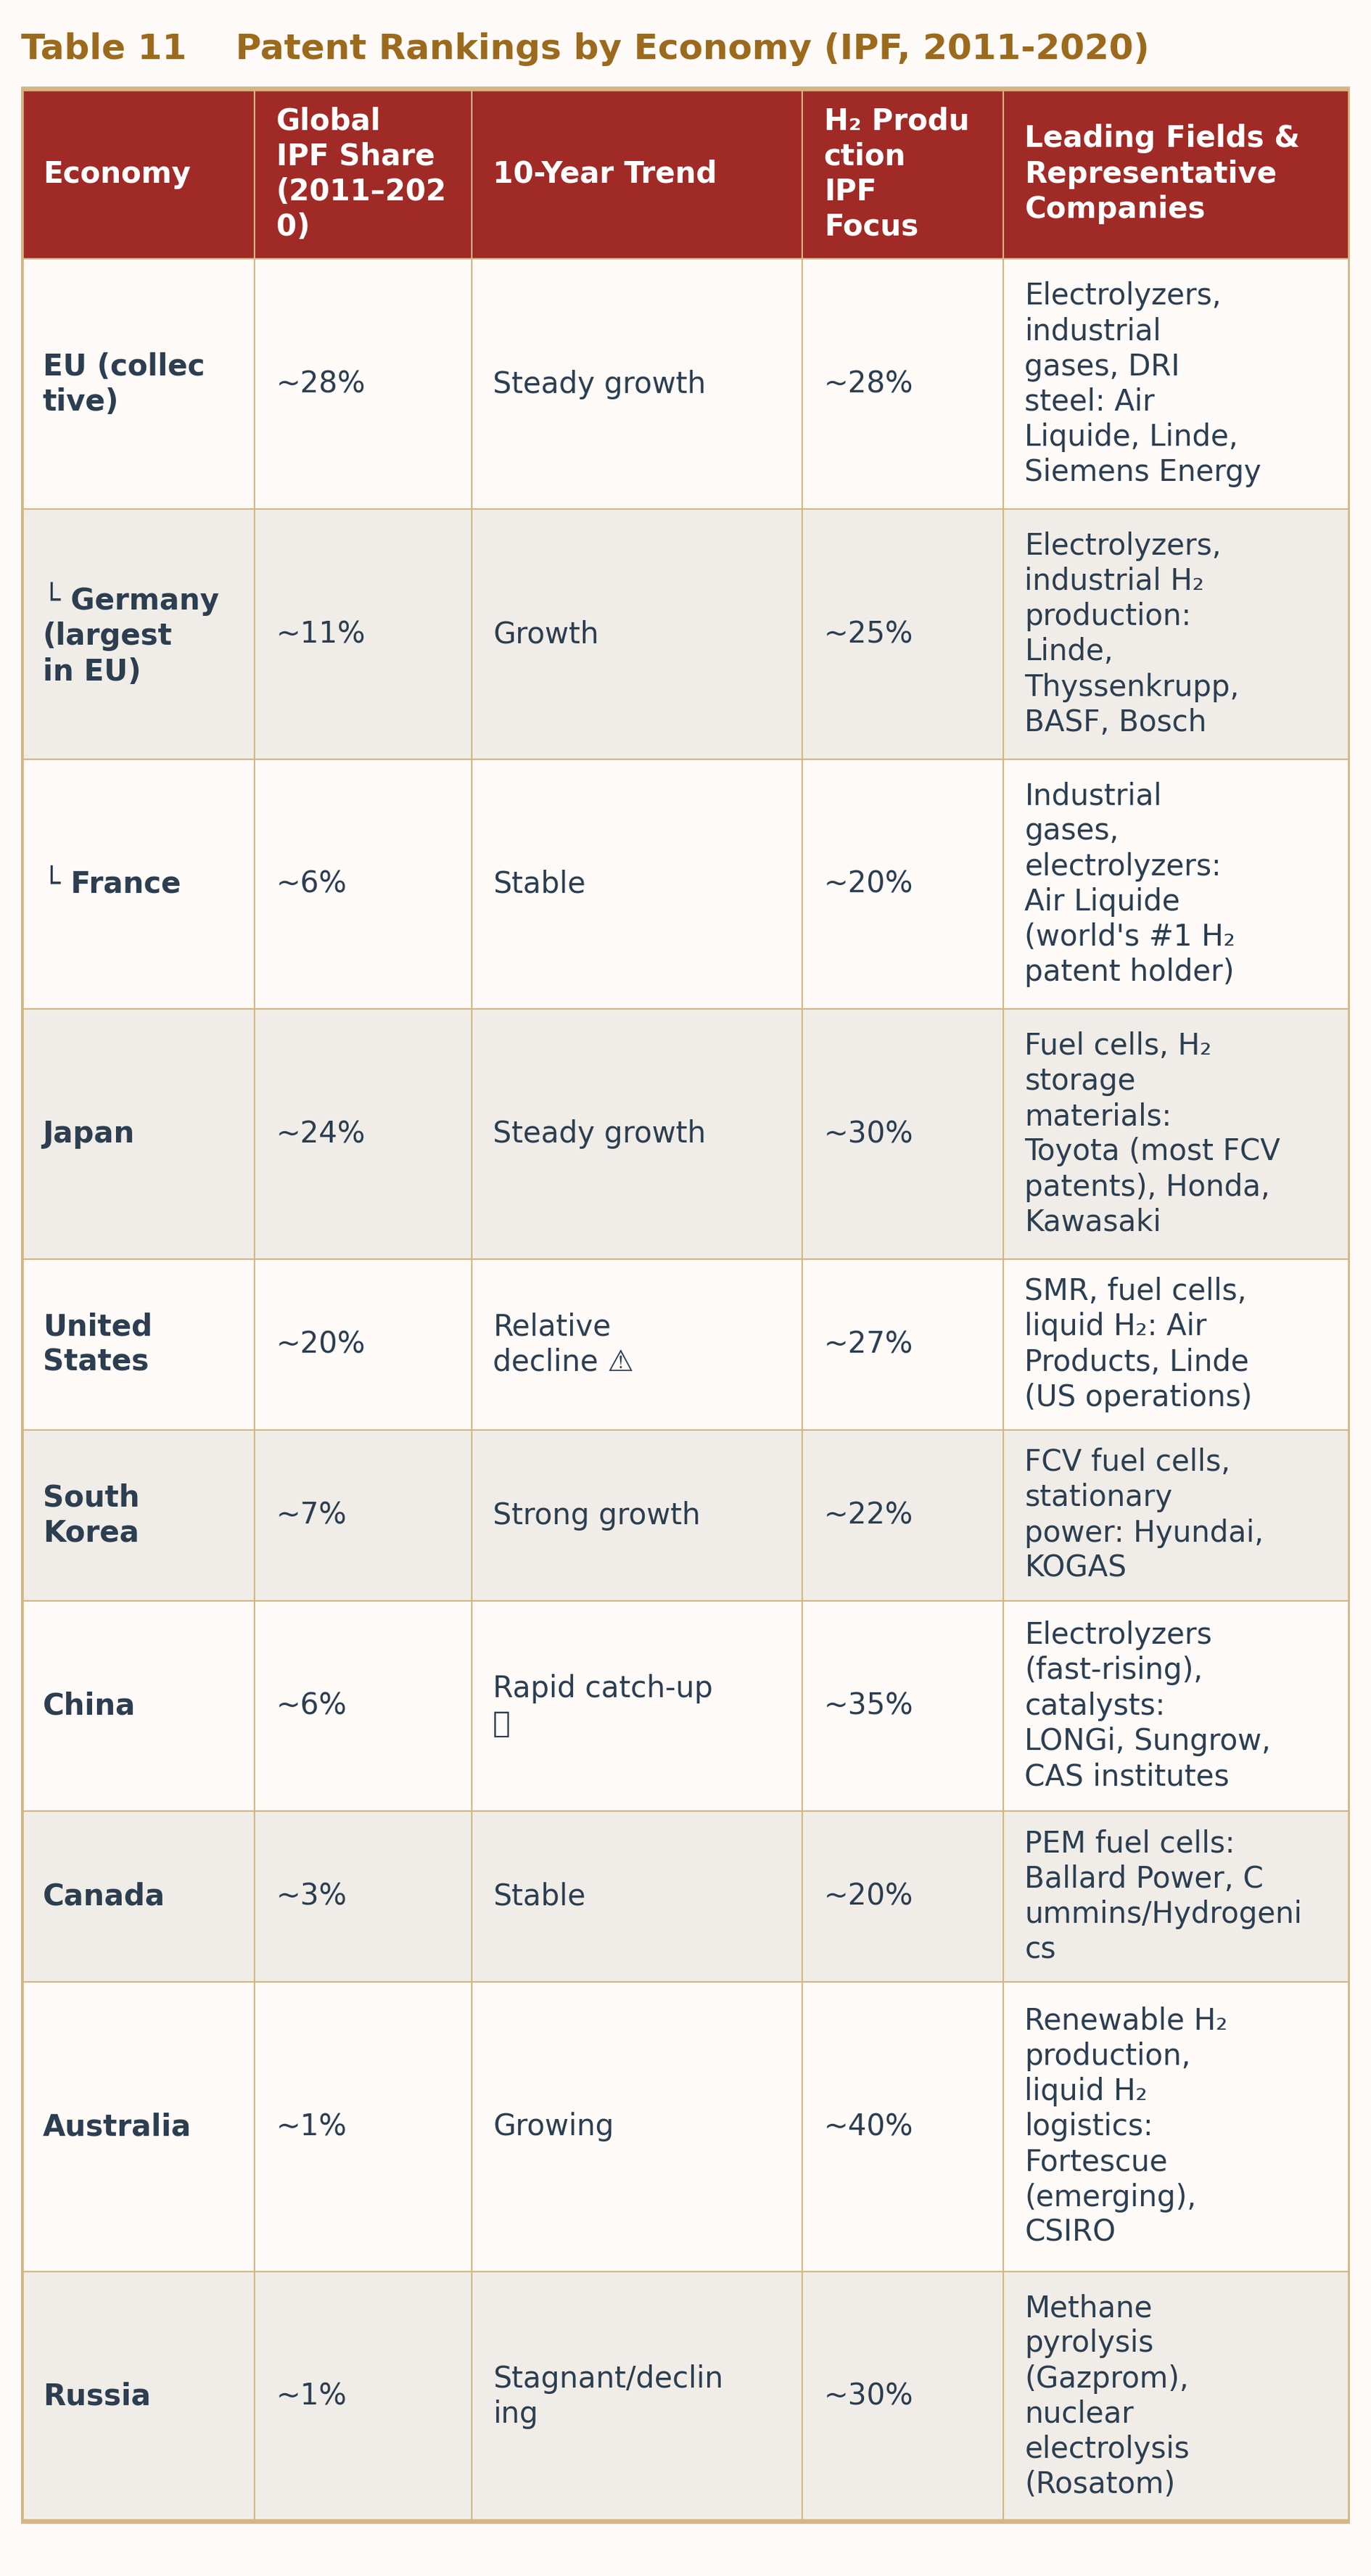
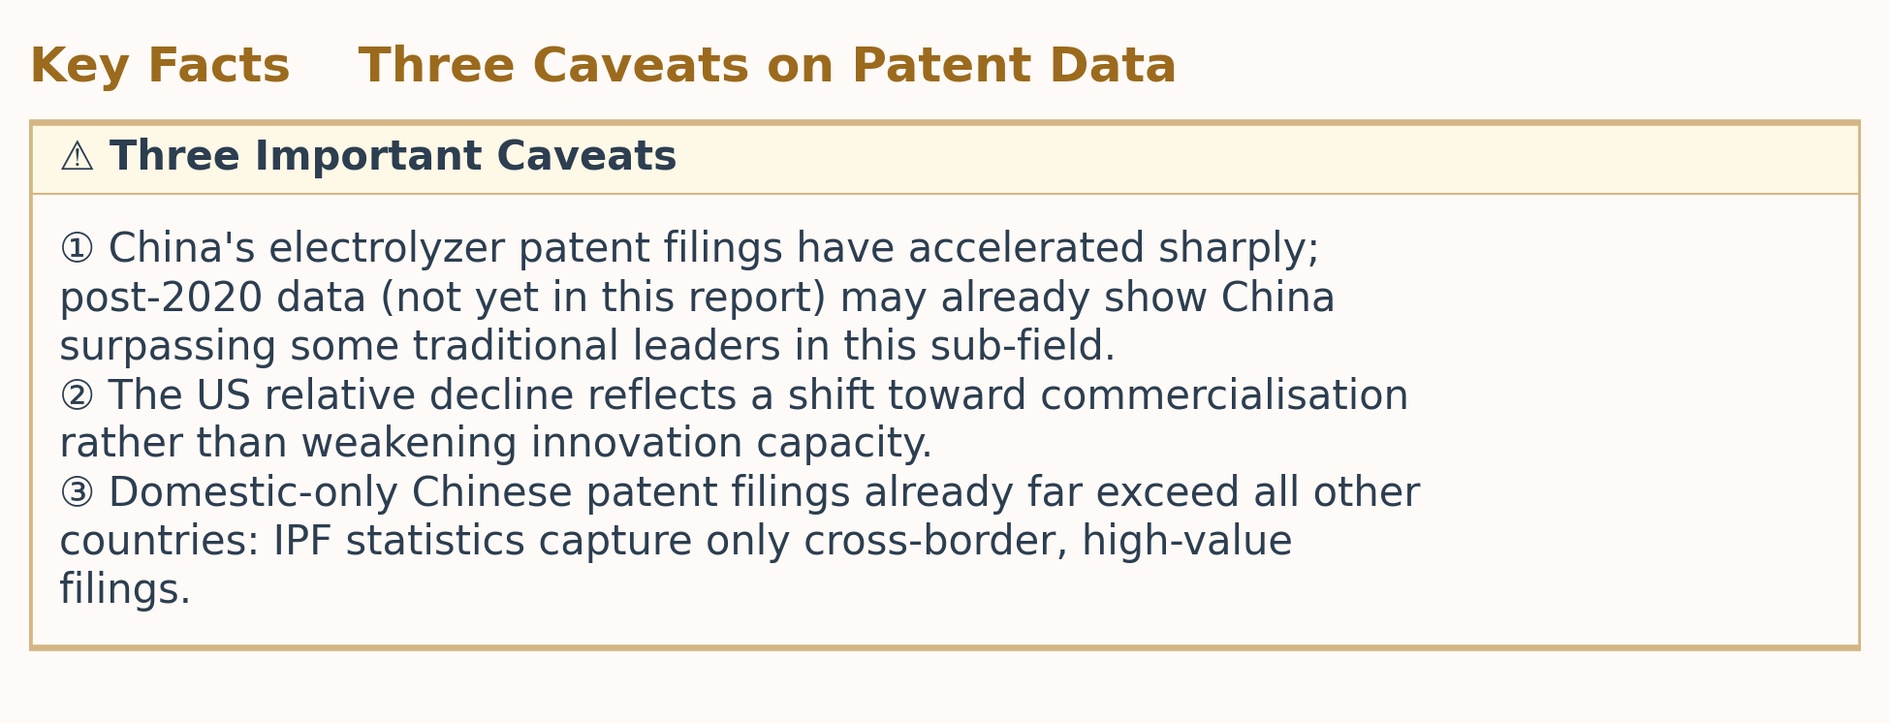
Based on EPO/IEA 2023 report Hydrogen Patents for a Clean Energy Future, using International Patent Families (IPF), meaning patents filed in two or more countries, representing high-value, commercially significant innovation: over 2011–2020:
VIII. Hydrogen End-Use Industries
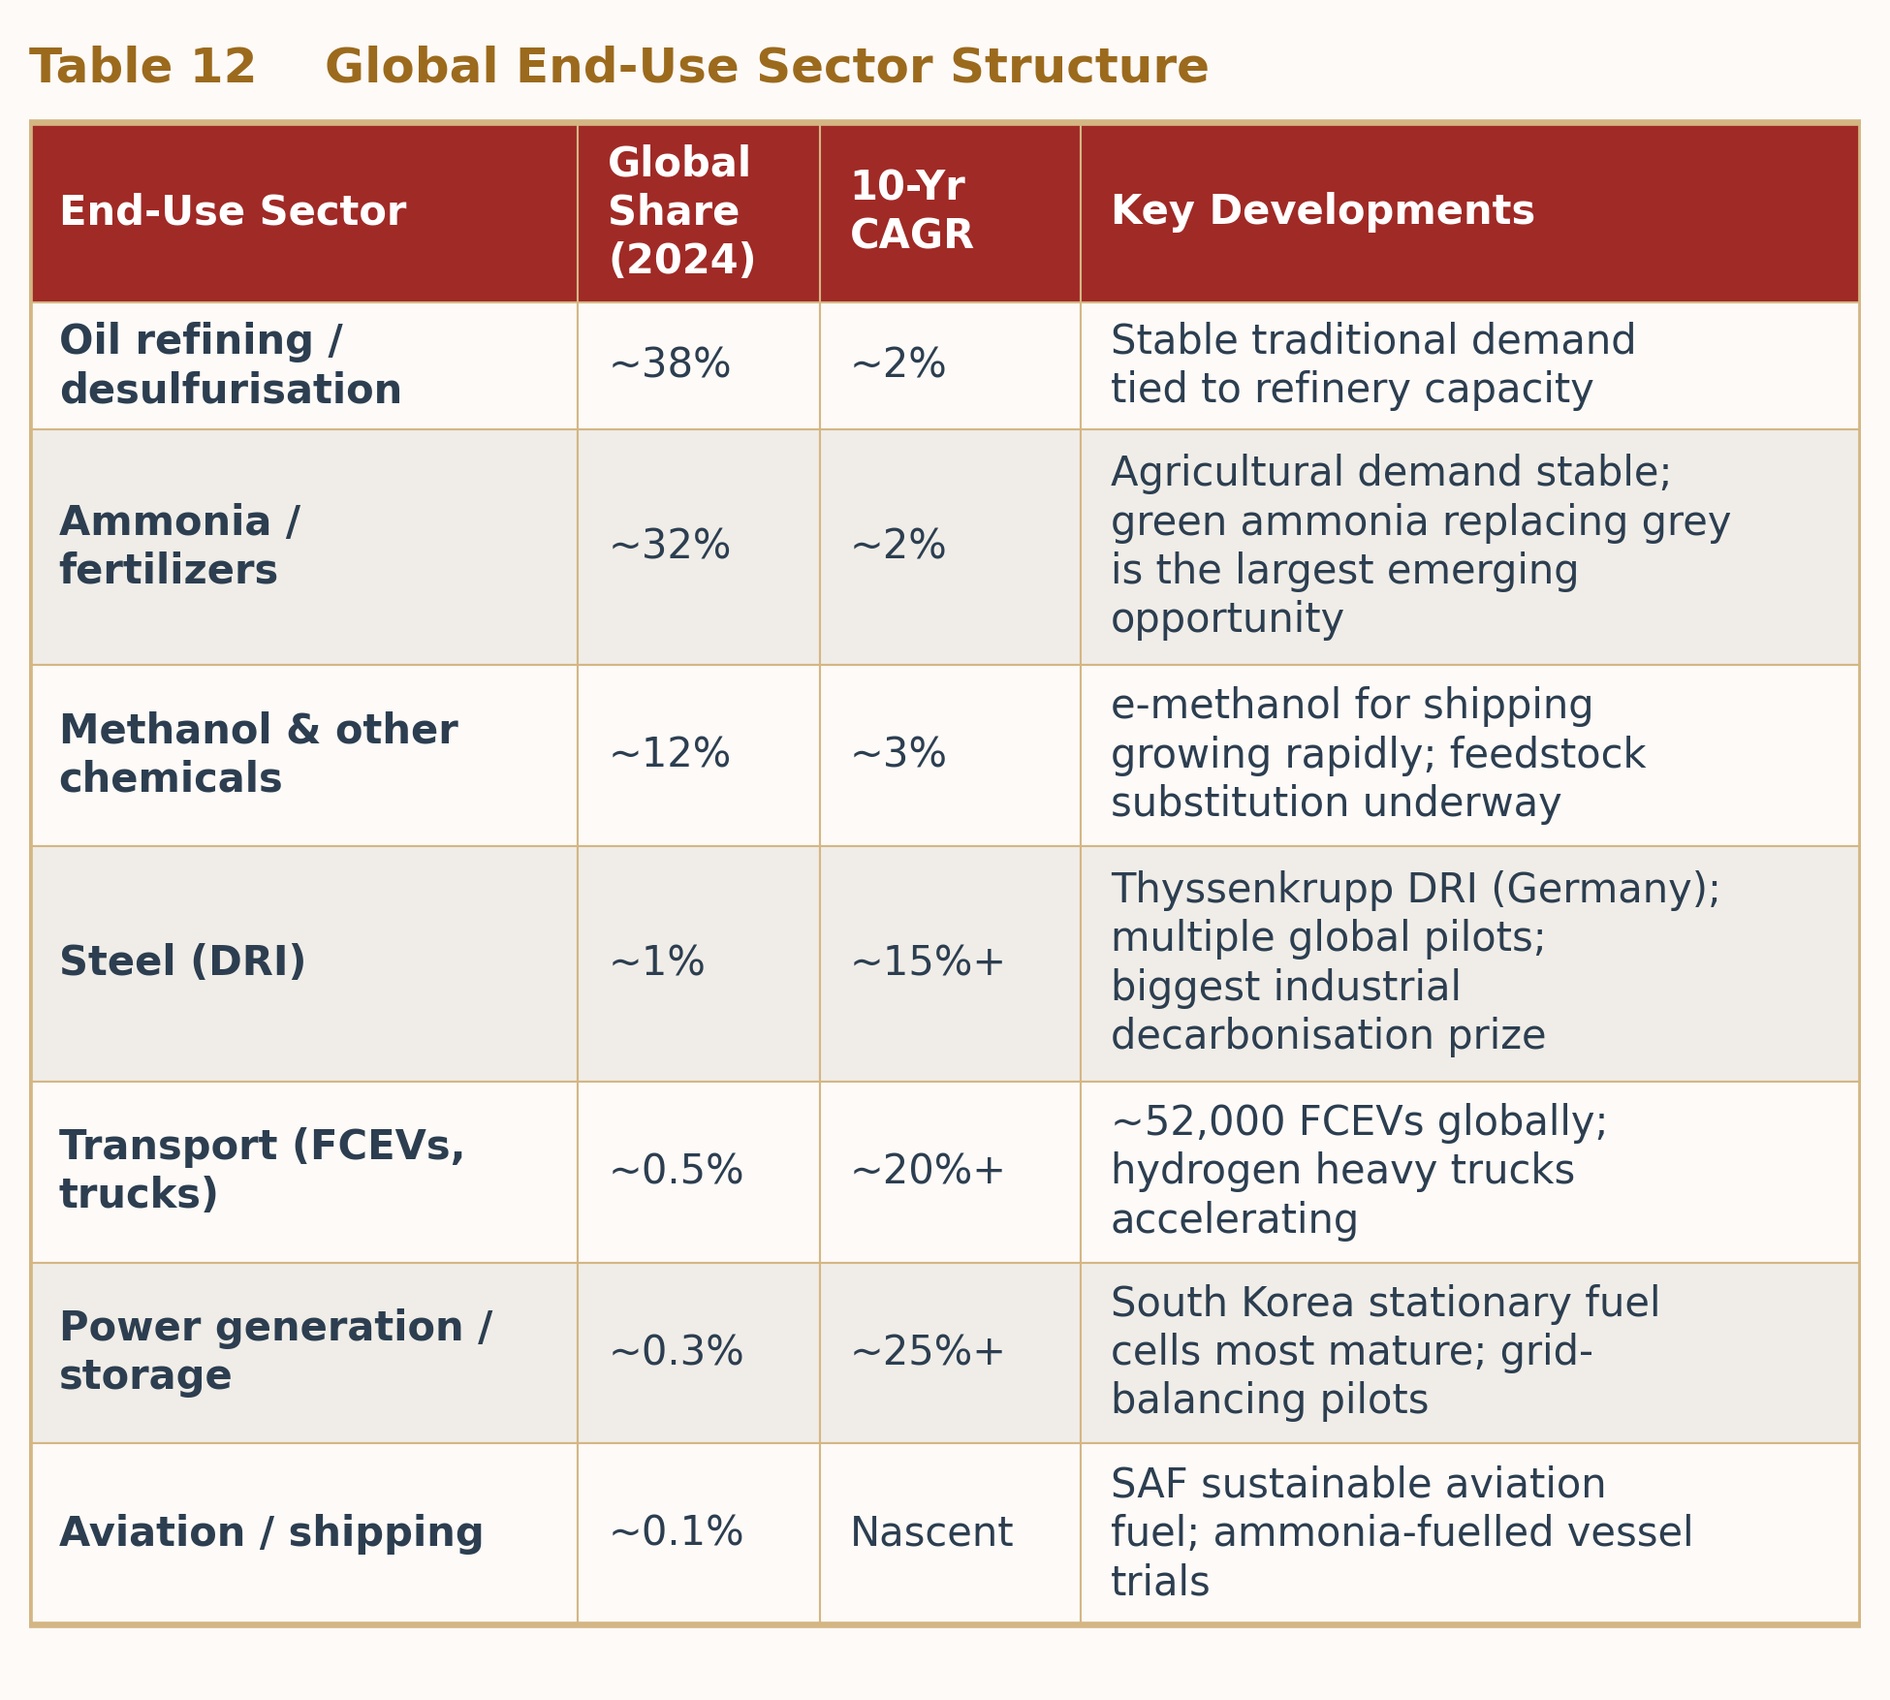
1. Global End-Use Structure: Traditional Applications Dominate
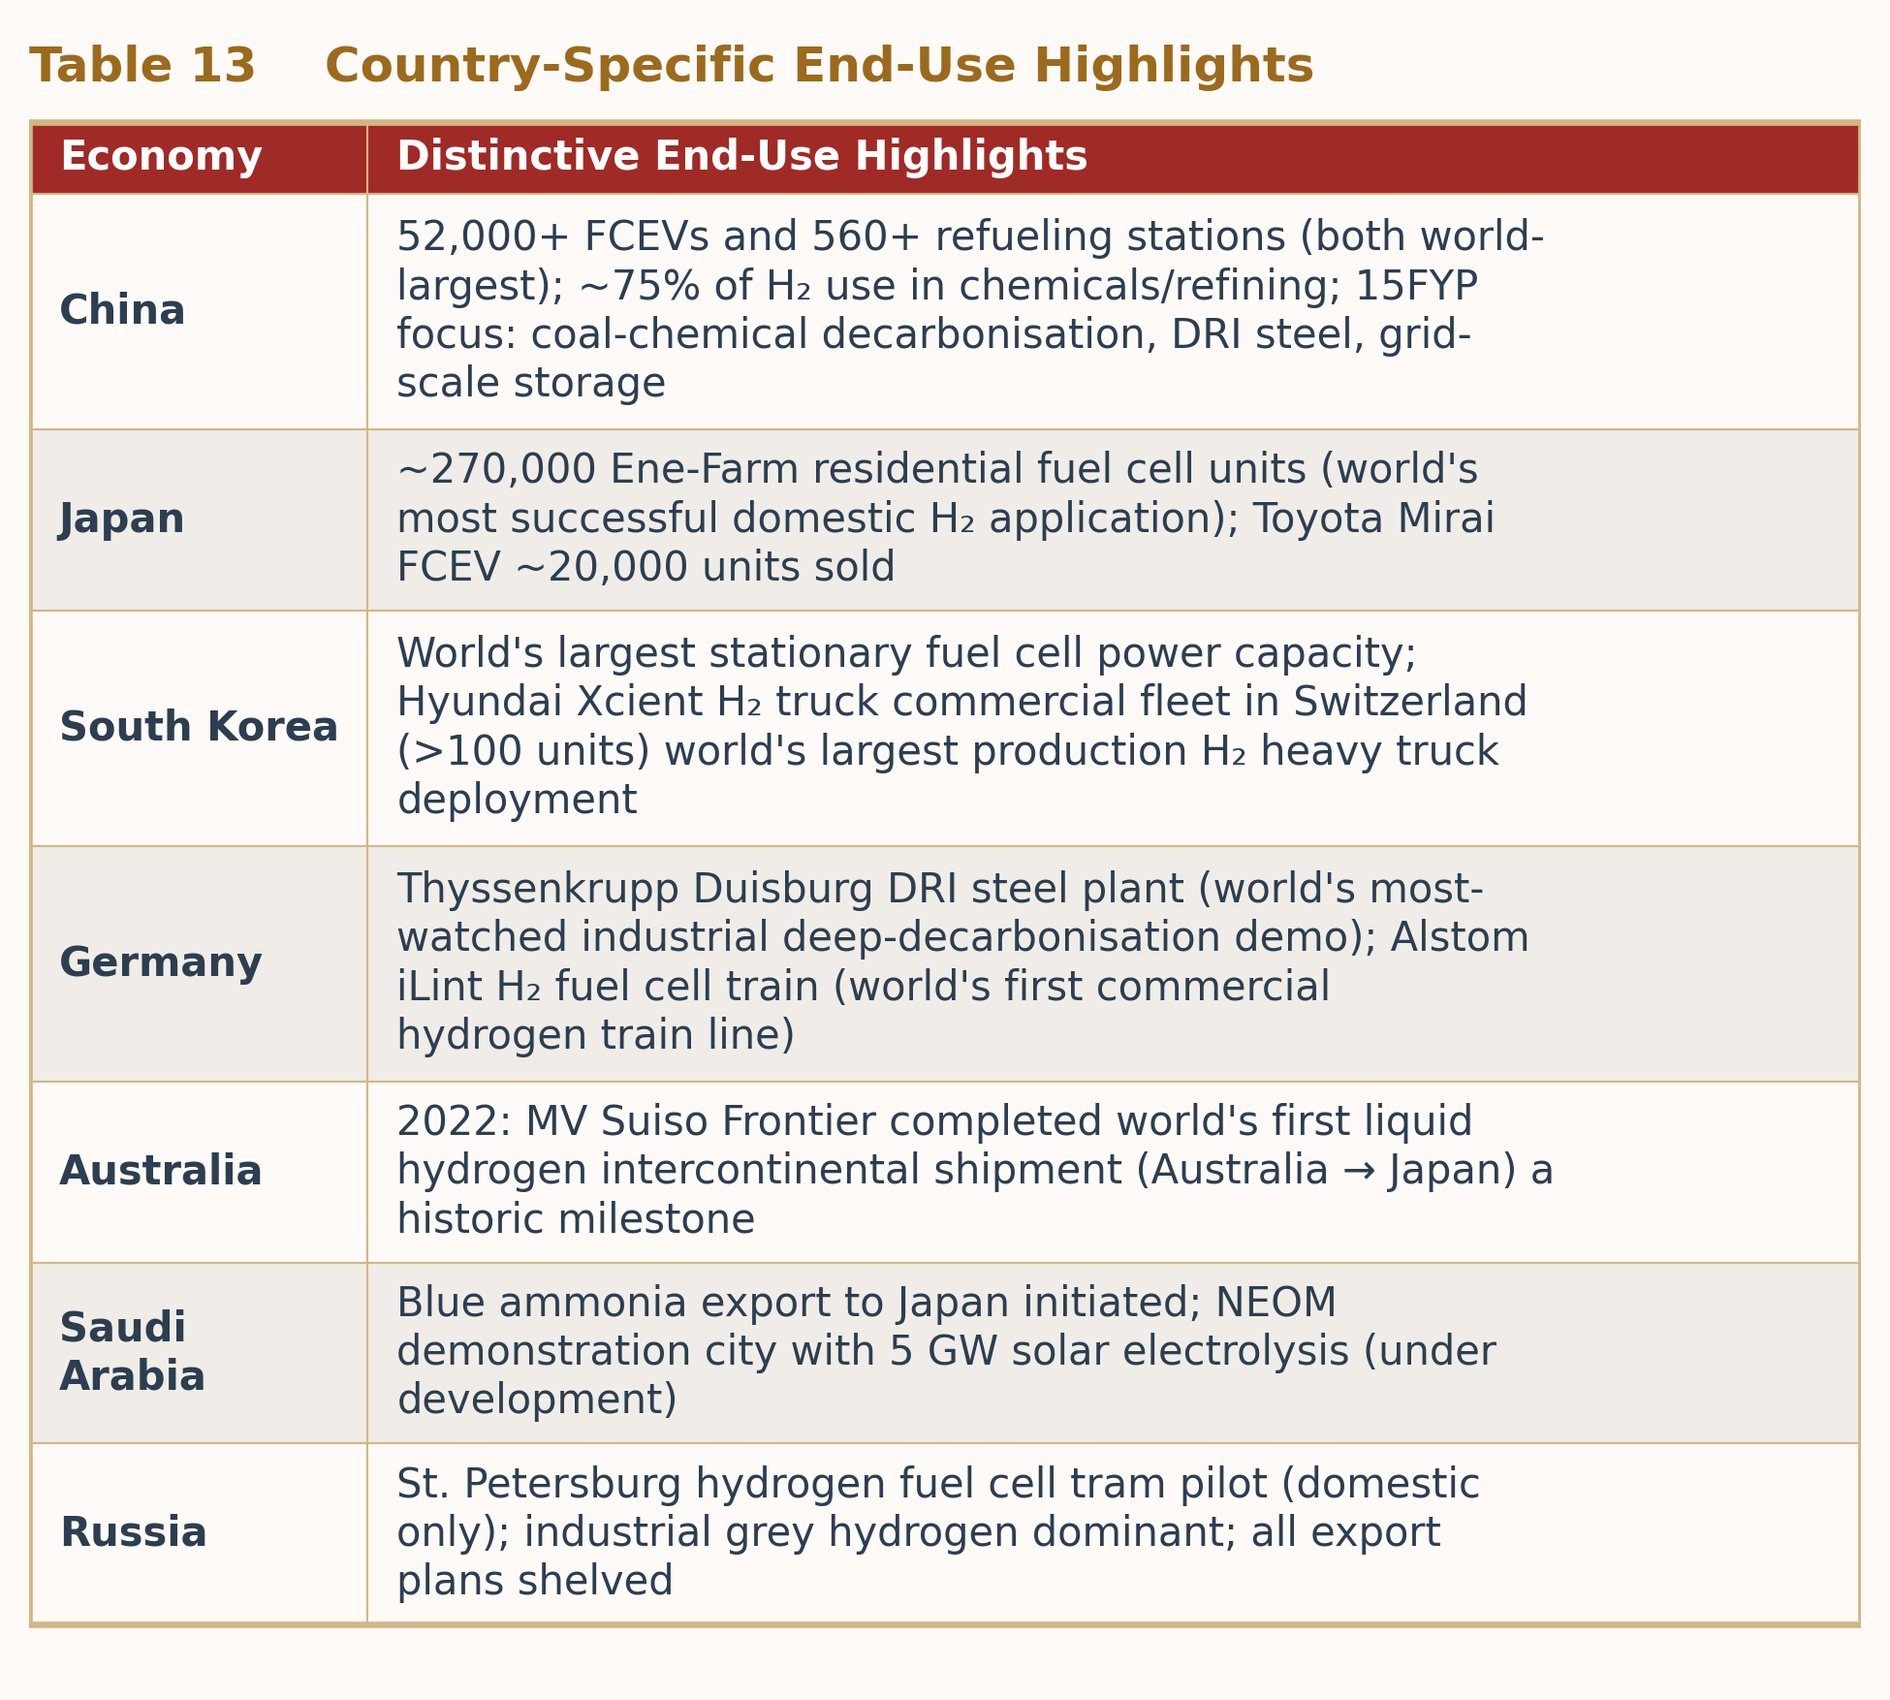
2. Country-Specific End-Use Highlights
IX. 10-Year Trend Analysis: Line Charts (2015–2024)
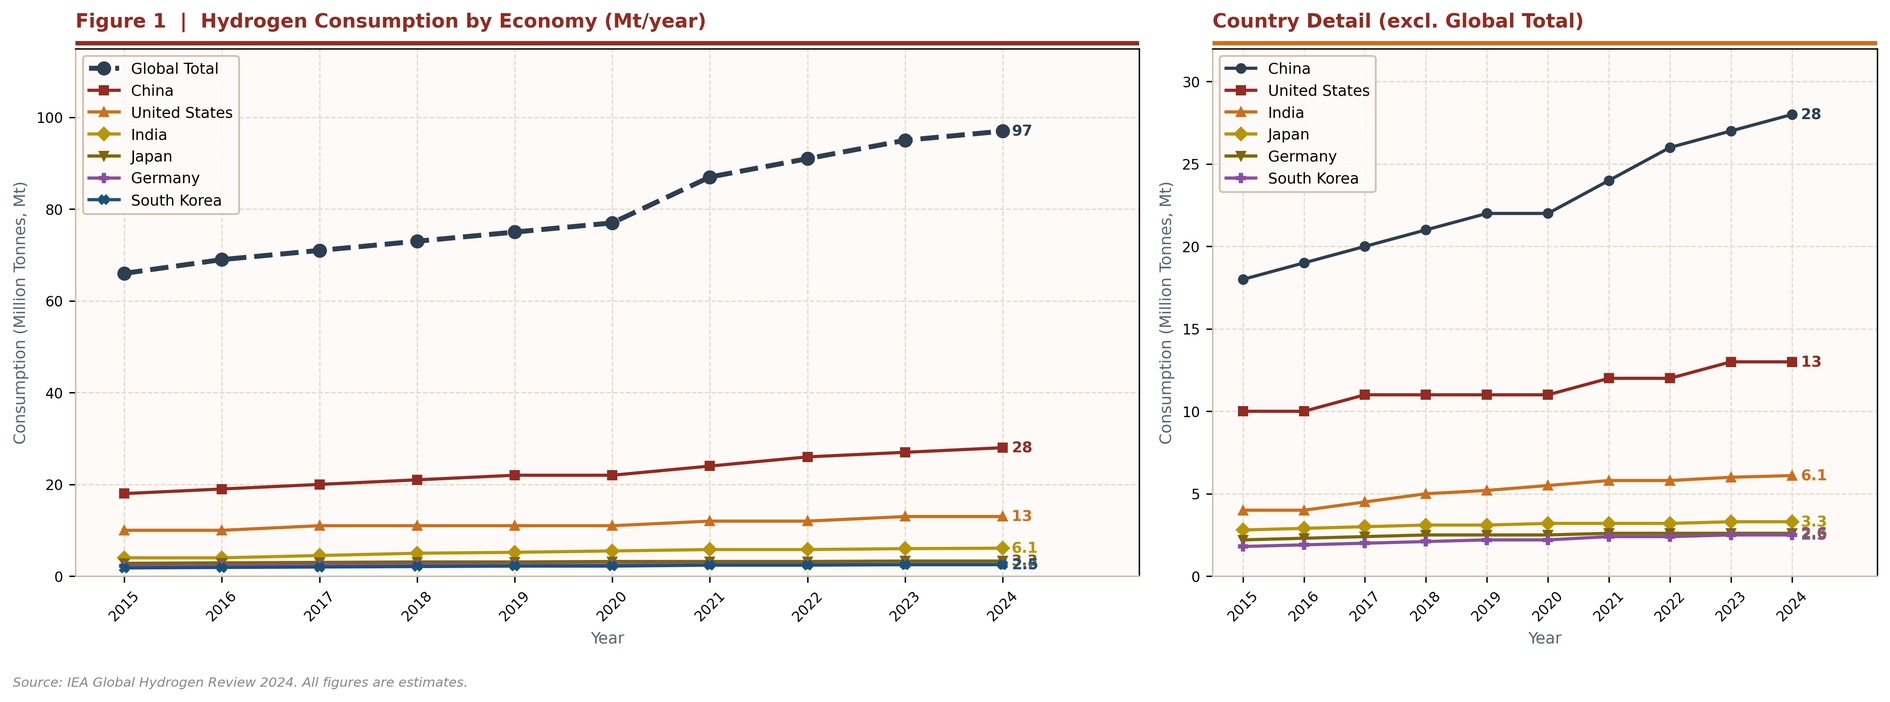
1. Global Hydrogen Consumption (Mt)
Global hydrogen consumption rose from ~66 Mt in 2015 to ~97–100 Mt in 2024, a CAGR of ~3.8%. China drove the majority of incremental growth, expanding from 18 Mt to 28 Mt (+10 Mt, or ~32% of global incremental demand). The US and India grew steadily; Japan and South Korea have approached a plateau.
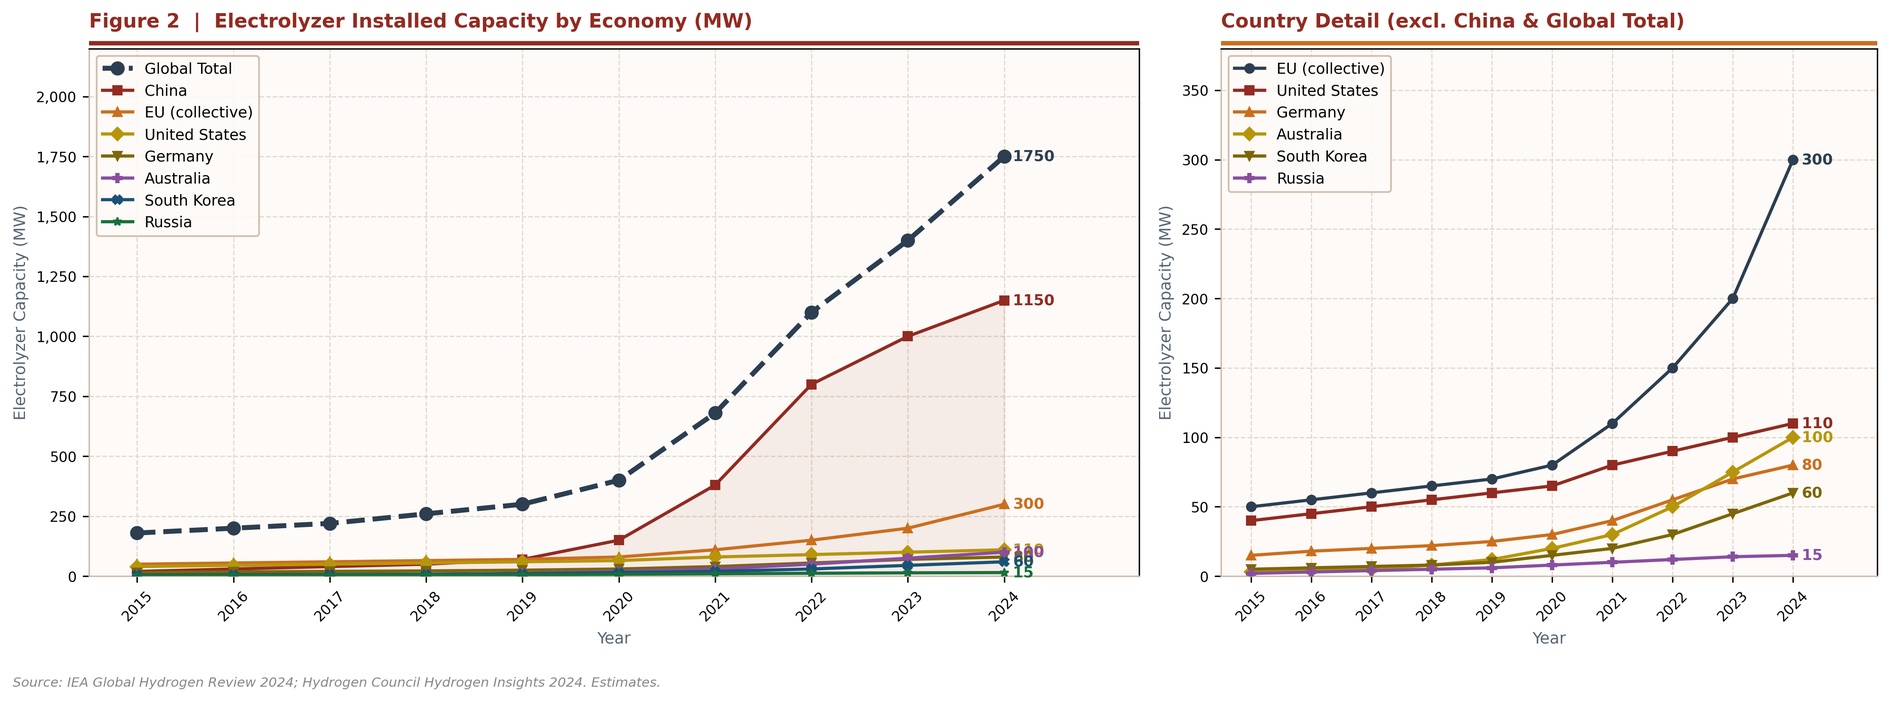
2. Electrolyzer Installed Capacity (MW)
Global electrolyzer capacity expanded from ~180 MW in 2015 to ~1,750 MW in 2024, growing nearly 10-fold. China alone accounts for ~1,150 MW (66% of the global total), dwarfing every other economy. Russia stagnated at ~15 MW.
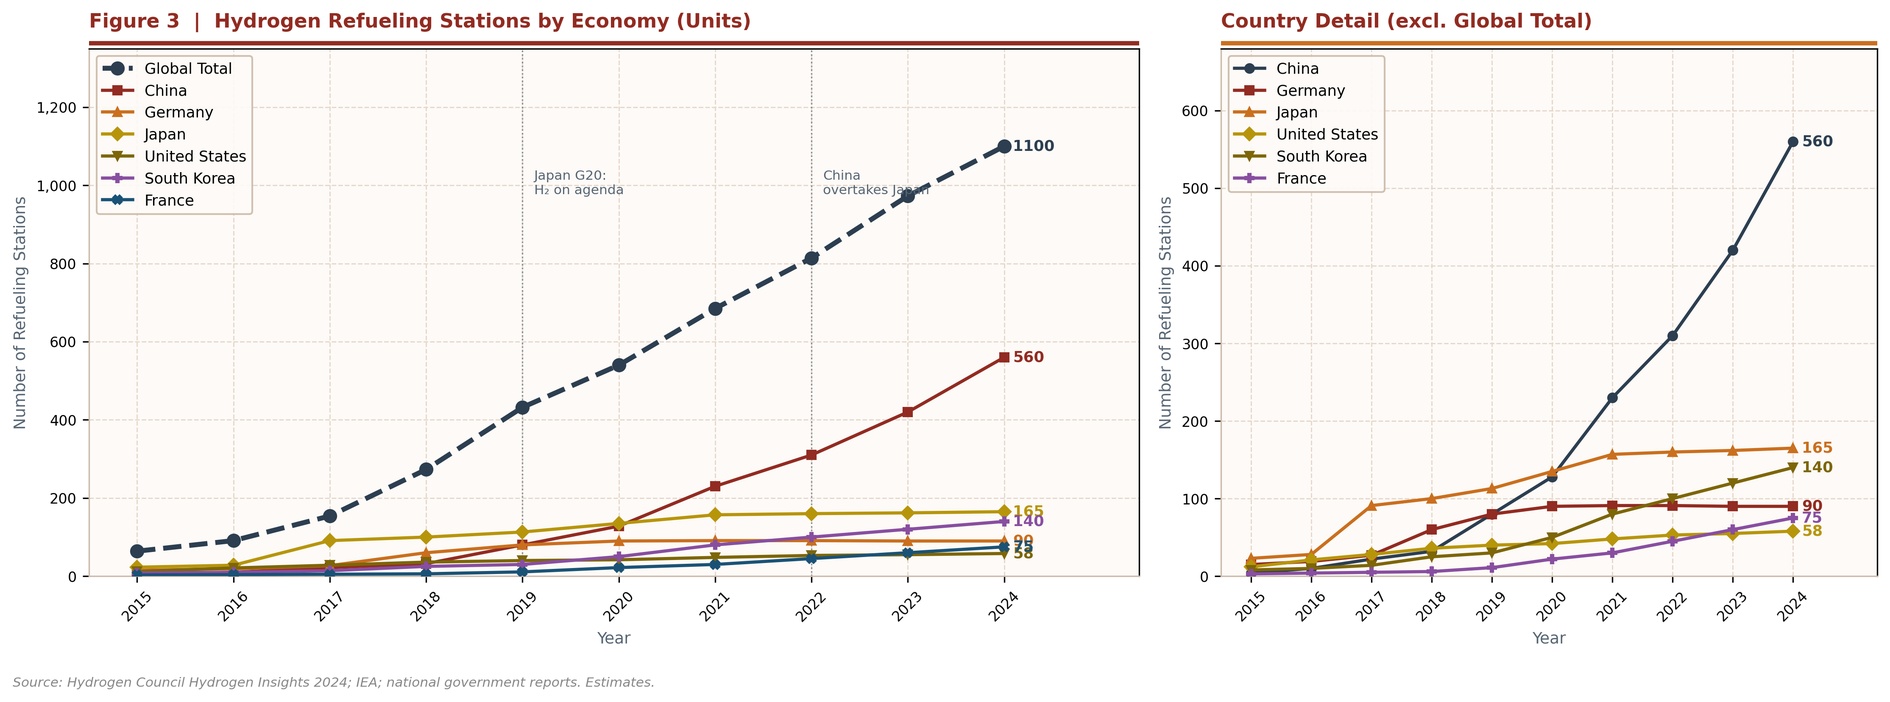
3. Hydrogen Refueling Stations (Units)
Global refueling stations grew from ~64 in 2015 to ~1,100 in 2024. China overtook Japan in 2022 to claim the top position, reaching 560+. Germany plateaued at ~90 stations; South Korea expanded rapidly on government subsidies; Japan maintained a stable ~165 stations.
X. China’s Two Core Models: Deep-Dive
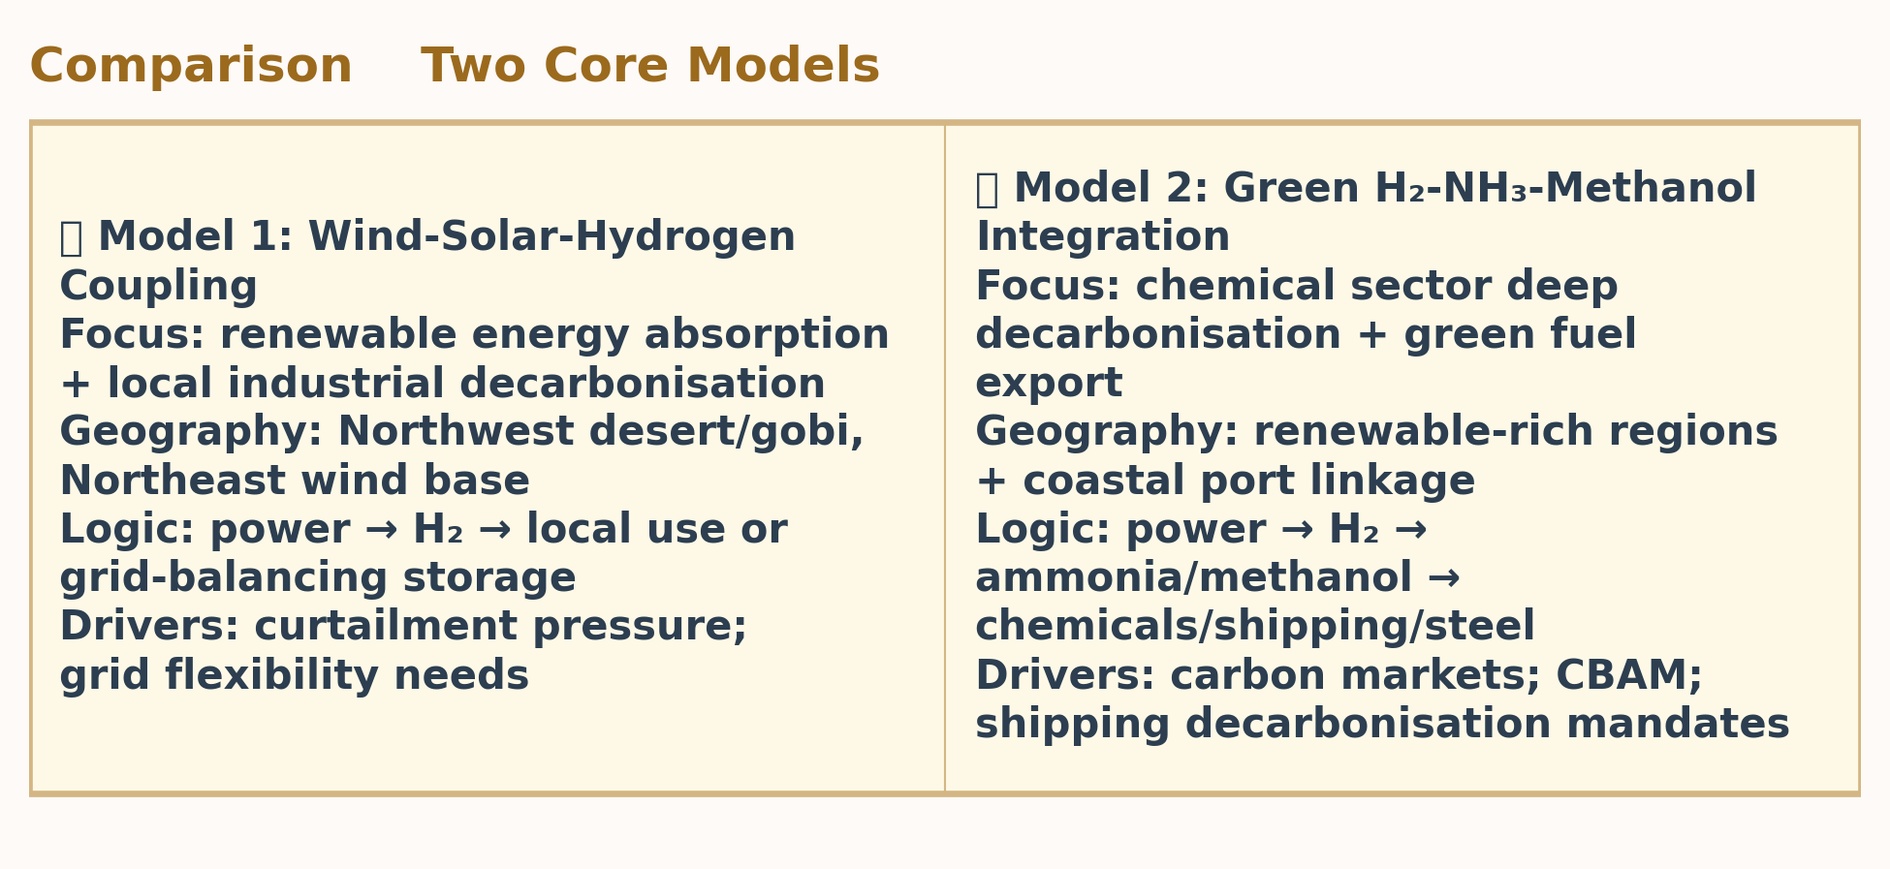
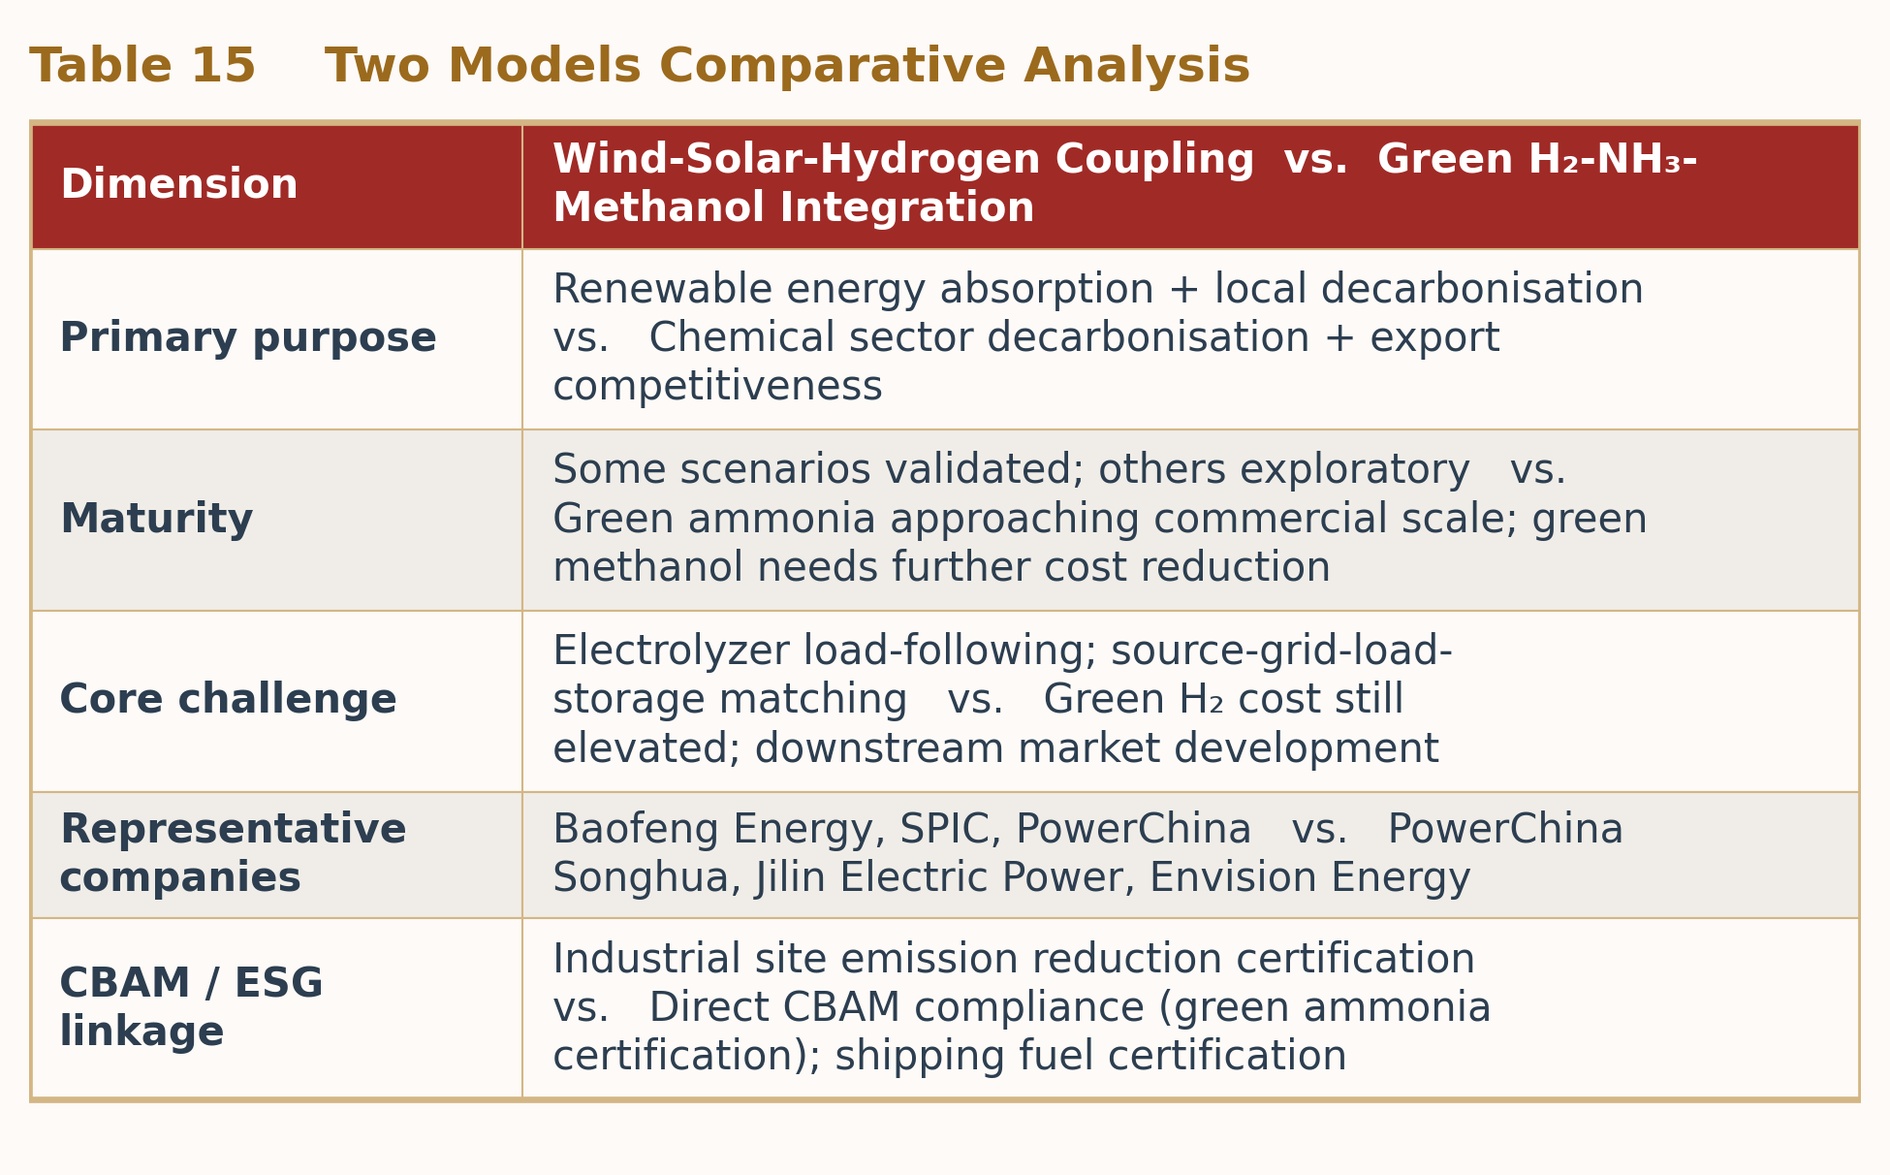
Within China’s 15FYP pilot framework, the NEA explicitly designates two primary commercial pathways: Wind-Solar-Hydrogen Coupling and Green Hydrogen-Ammonia-Methanol Integration. These are complementary, not competing: the first focuses on energy-side integration and local consumption; the second focuses on downstream product-chain extension and export orientation. Together they form the backbone of China’s hydrogen commercialisation strategy.
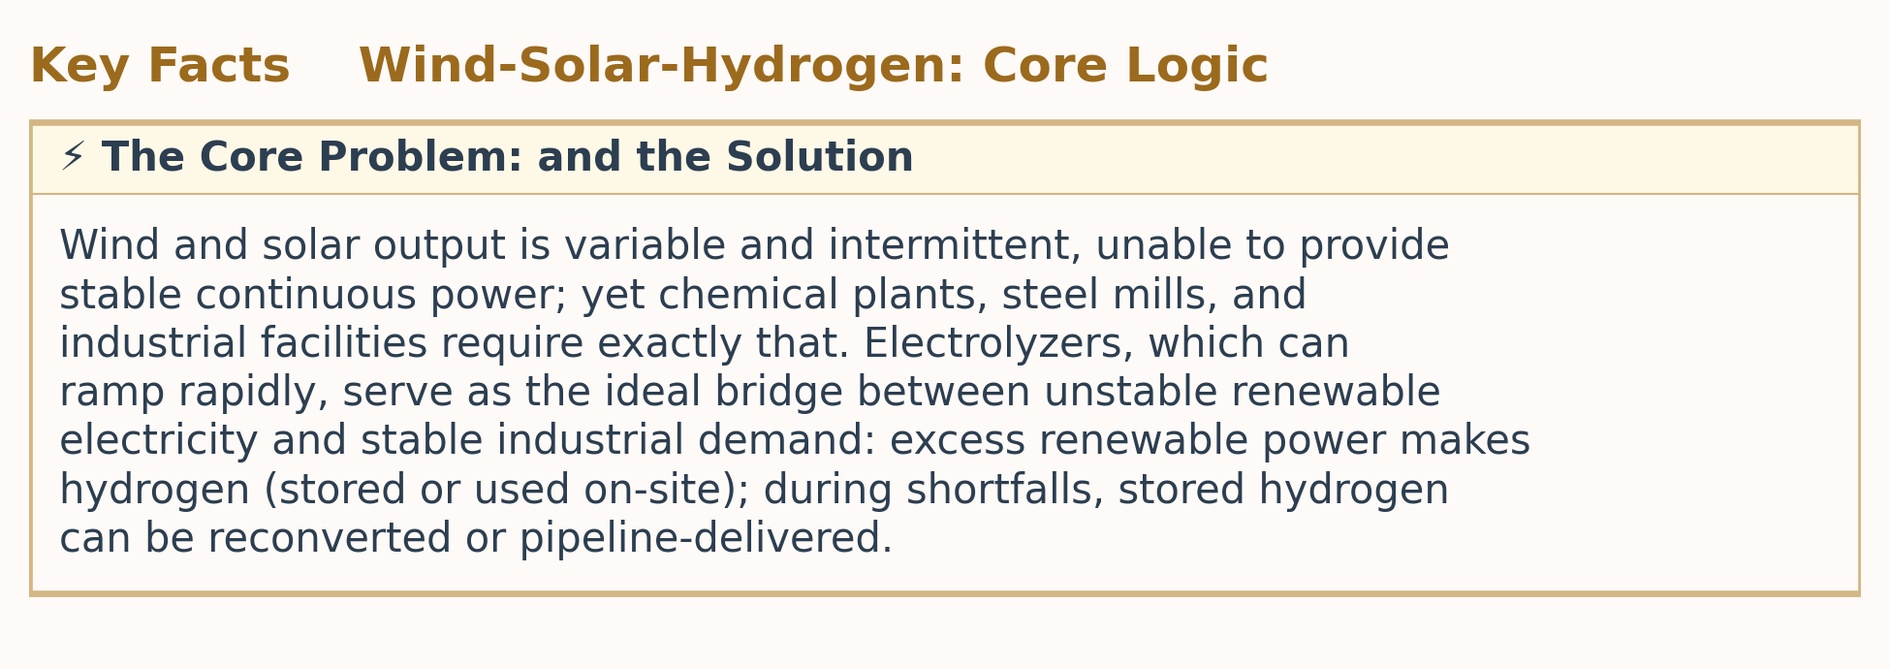
1. Wind-Solar-Hydrogen Coupling: Grid’s ‘Ballast Stone’
Three Application Scenarios
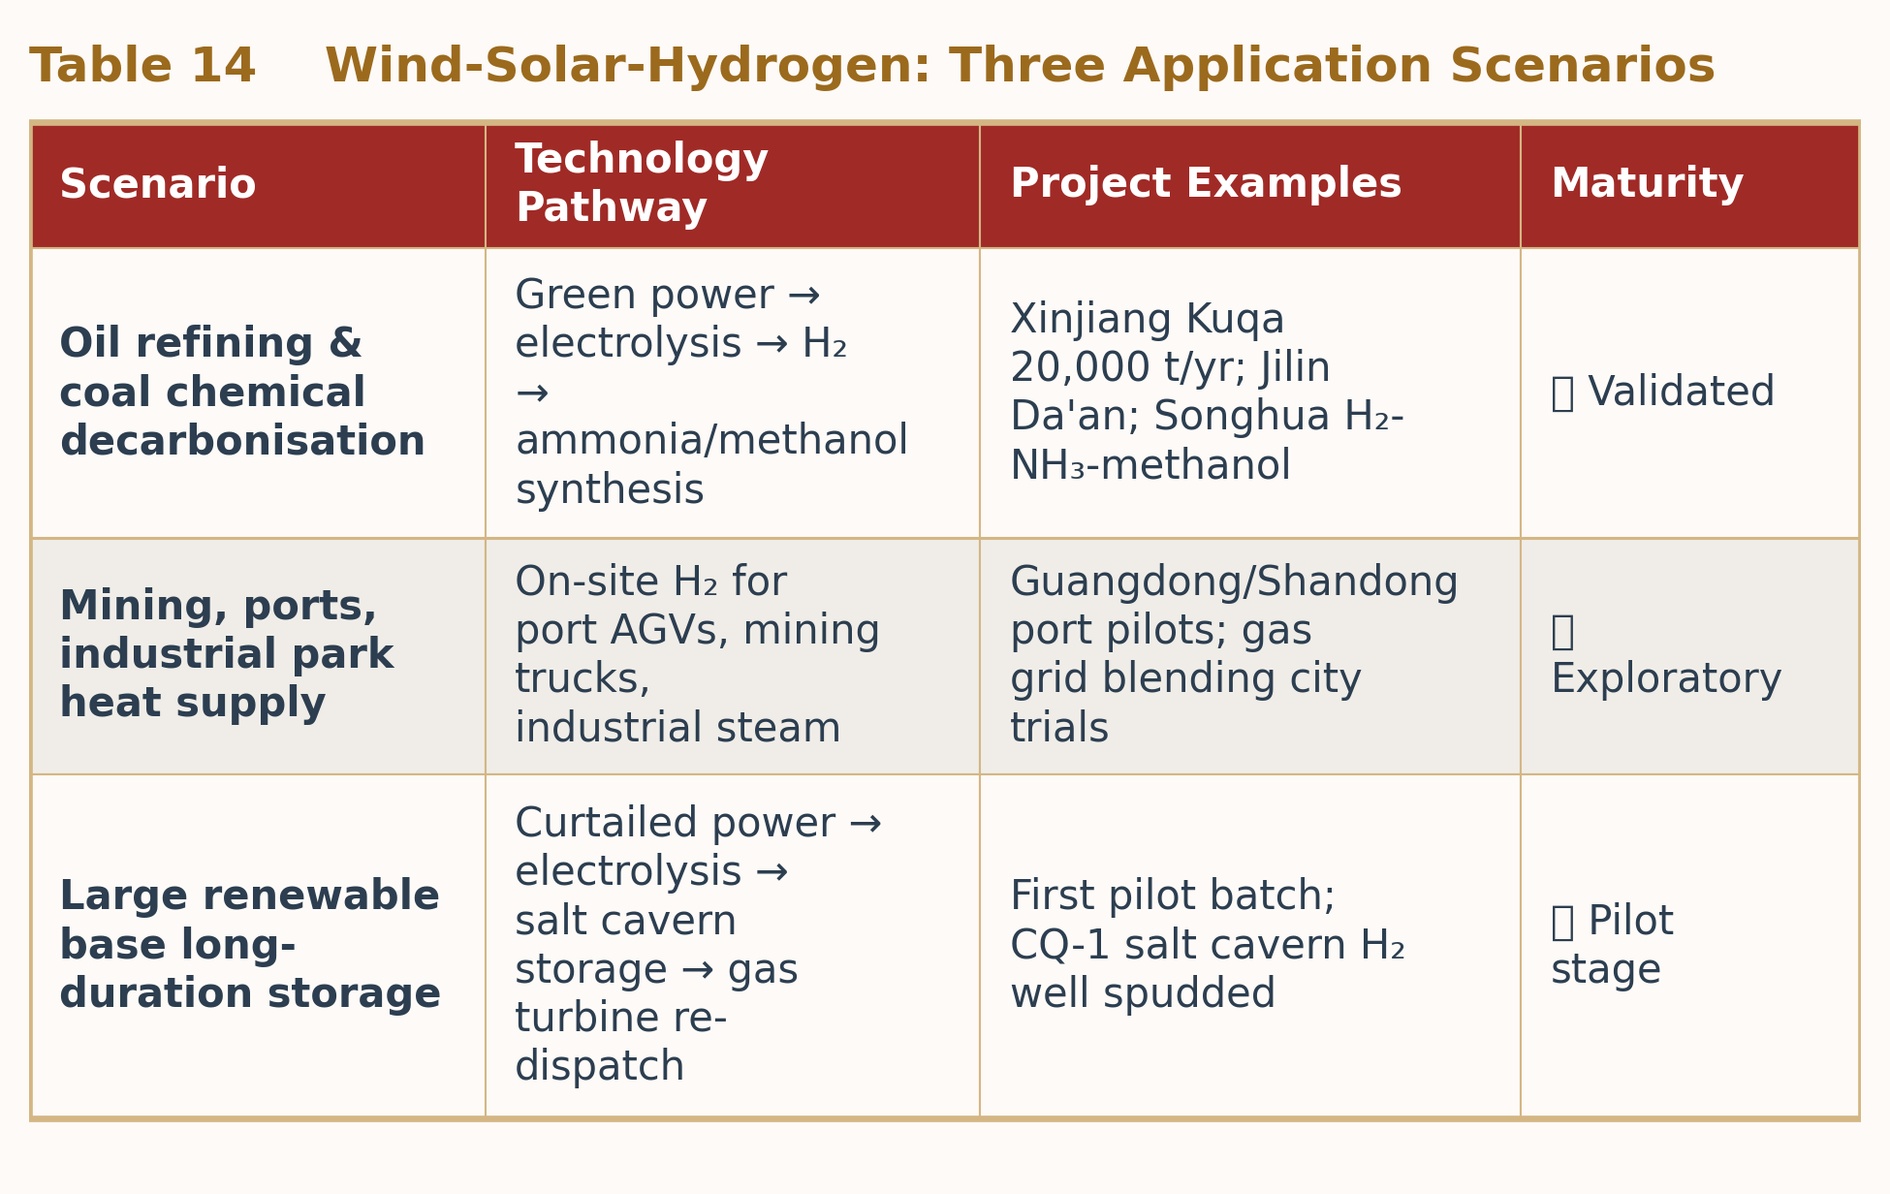
Flagship Case: HyFlow (Blue Hydrogen No.1): Launched by PowerChina in December 2025. Configuration: 200 MW wind + 50 MW solar → 45,000 t/yr green H₂ → 200,000 t/yr green ammonia and methanol. Annual CO₂ reduction: 300,000 tonnes. Four world-leading technical breakthroughs in source-grid-load-storage matching; green ammonia cost approaching conventional blue ammonia parity.
2. Green Hydrogen-Ammonia-Methanol Integration: A Multi-Trillion-RMB Market
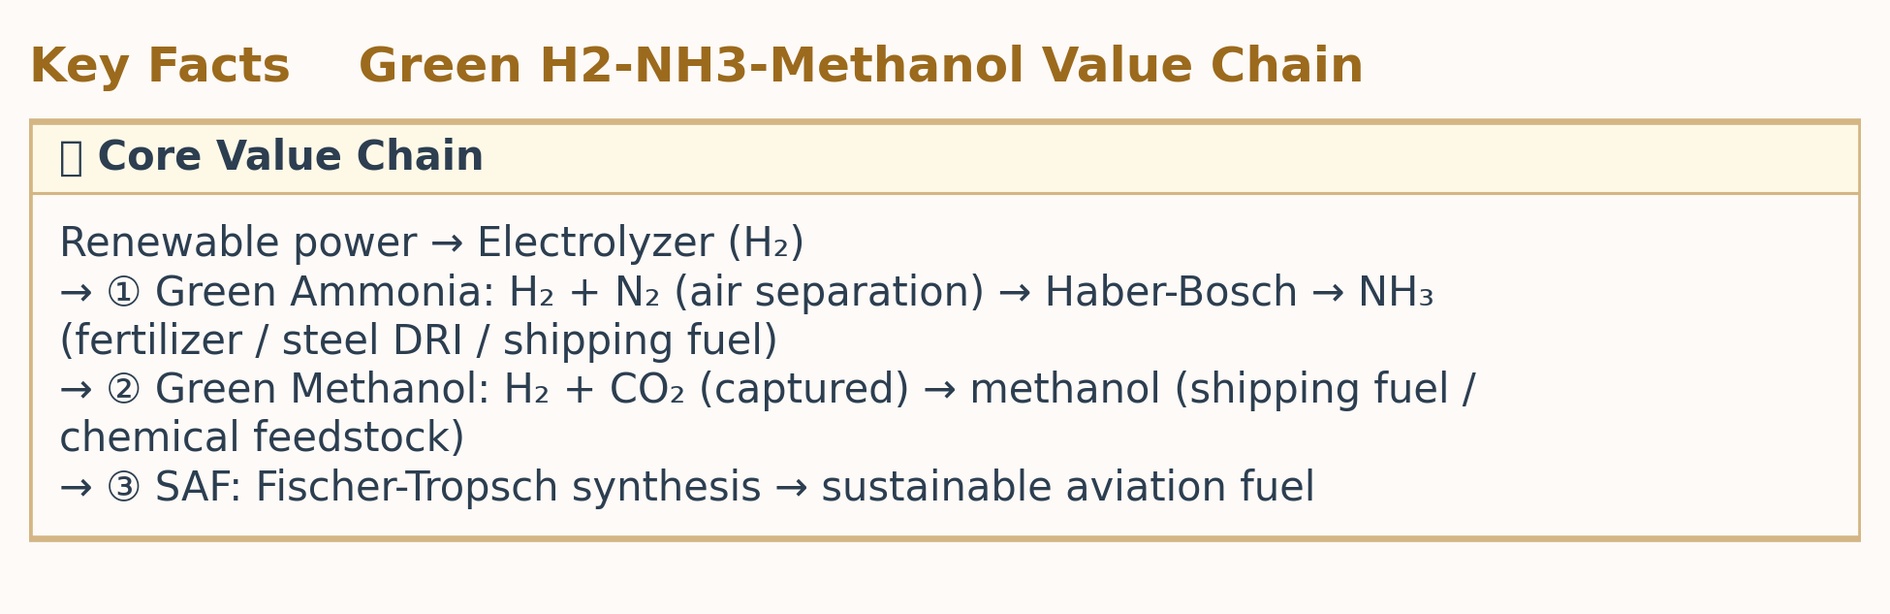
Green Ammonia: Industrial Deep Decarbonisation Battleground
- Global ammonia production exceeds 200 Mt/year; China accounts for ~30%. Conventional coal-based ammonia is one of the chemical sector’s largest single emission sources.
- Ammonia is a natural hydrogen carrier (~17.6% H₂ by weight); liquid ammonia stores at ambient temperature under ~8.5 bar (far cheaper to transport than liquid hydrogen).
- Steel DRI: ammonia as a reductant replacing coke addresses the hardest-to-abate emissions in integrated steelmaking.
- Market status: ~1.9 Mt/year planned capacity in active green ammonia projects; 57 confirmed green-hydrogen-fed projects (2024); world’s largest: PowerChina Songhua: 600,000 t/yr green ammonia + 60,000 t/yr green methanol, CNY 29.6bn investment.
Green Methanol: Shipping’s Emerging Fuel of Choice
- Regulatory driver: EU FuelEU Maritime Regulation in force: progressive carbon intensity penalties for vessels calling at EU ports. IMO 2050 net-zero target pushing Maersk, COSCO and others to seek alternatives.
- Advantages over liquid hydrogen: storable as liquid at ambient conditions; compatible with existing bunkering infrastructure; 1 litre of methanol yields twice the hydrogen of 1 litre of LH₂.
- Cost challenge: Electro-methanol currently ~USD 2,000–3,000/tonne vs. conventional bunker fuel at less than half that. Industry consensus: the gap narrows materially around 2030 as green electricity costs fall and carbon pricing tightens.
XI. Conclusions: Global Competitive Dynamics & ESG Implications
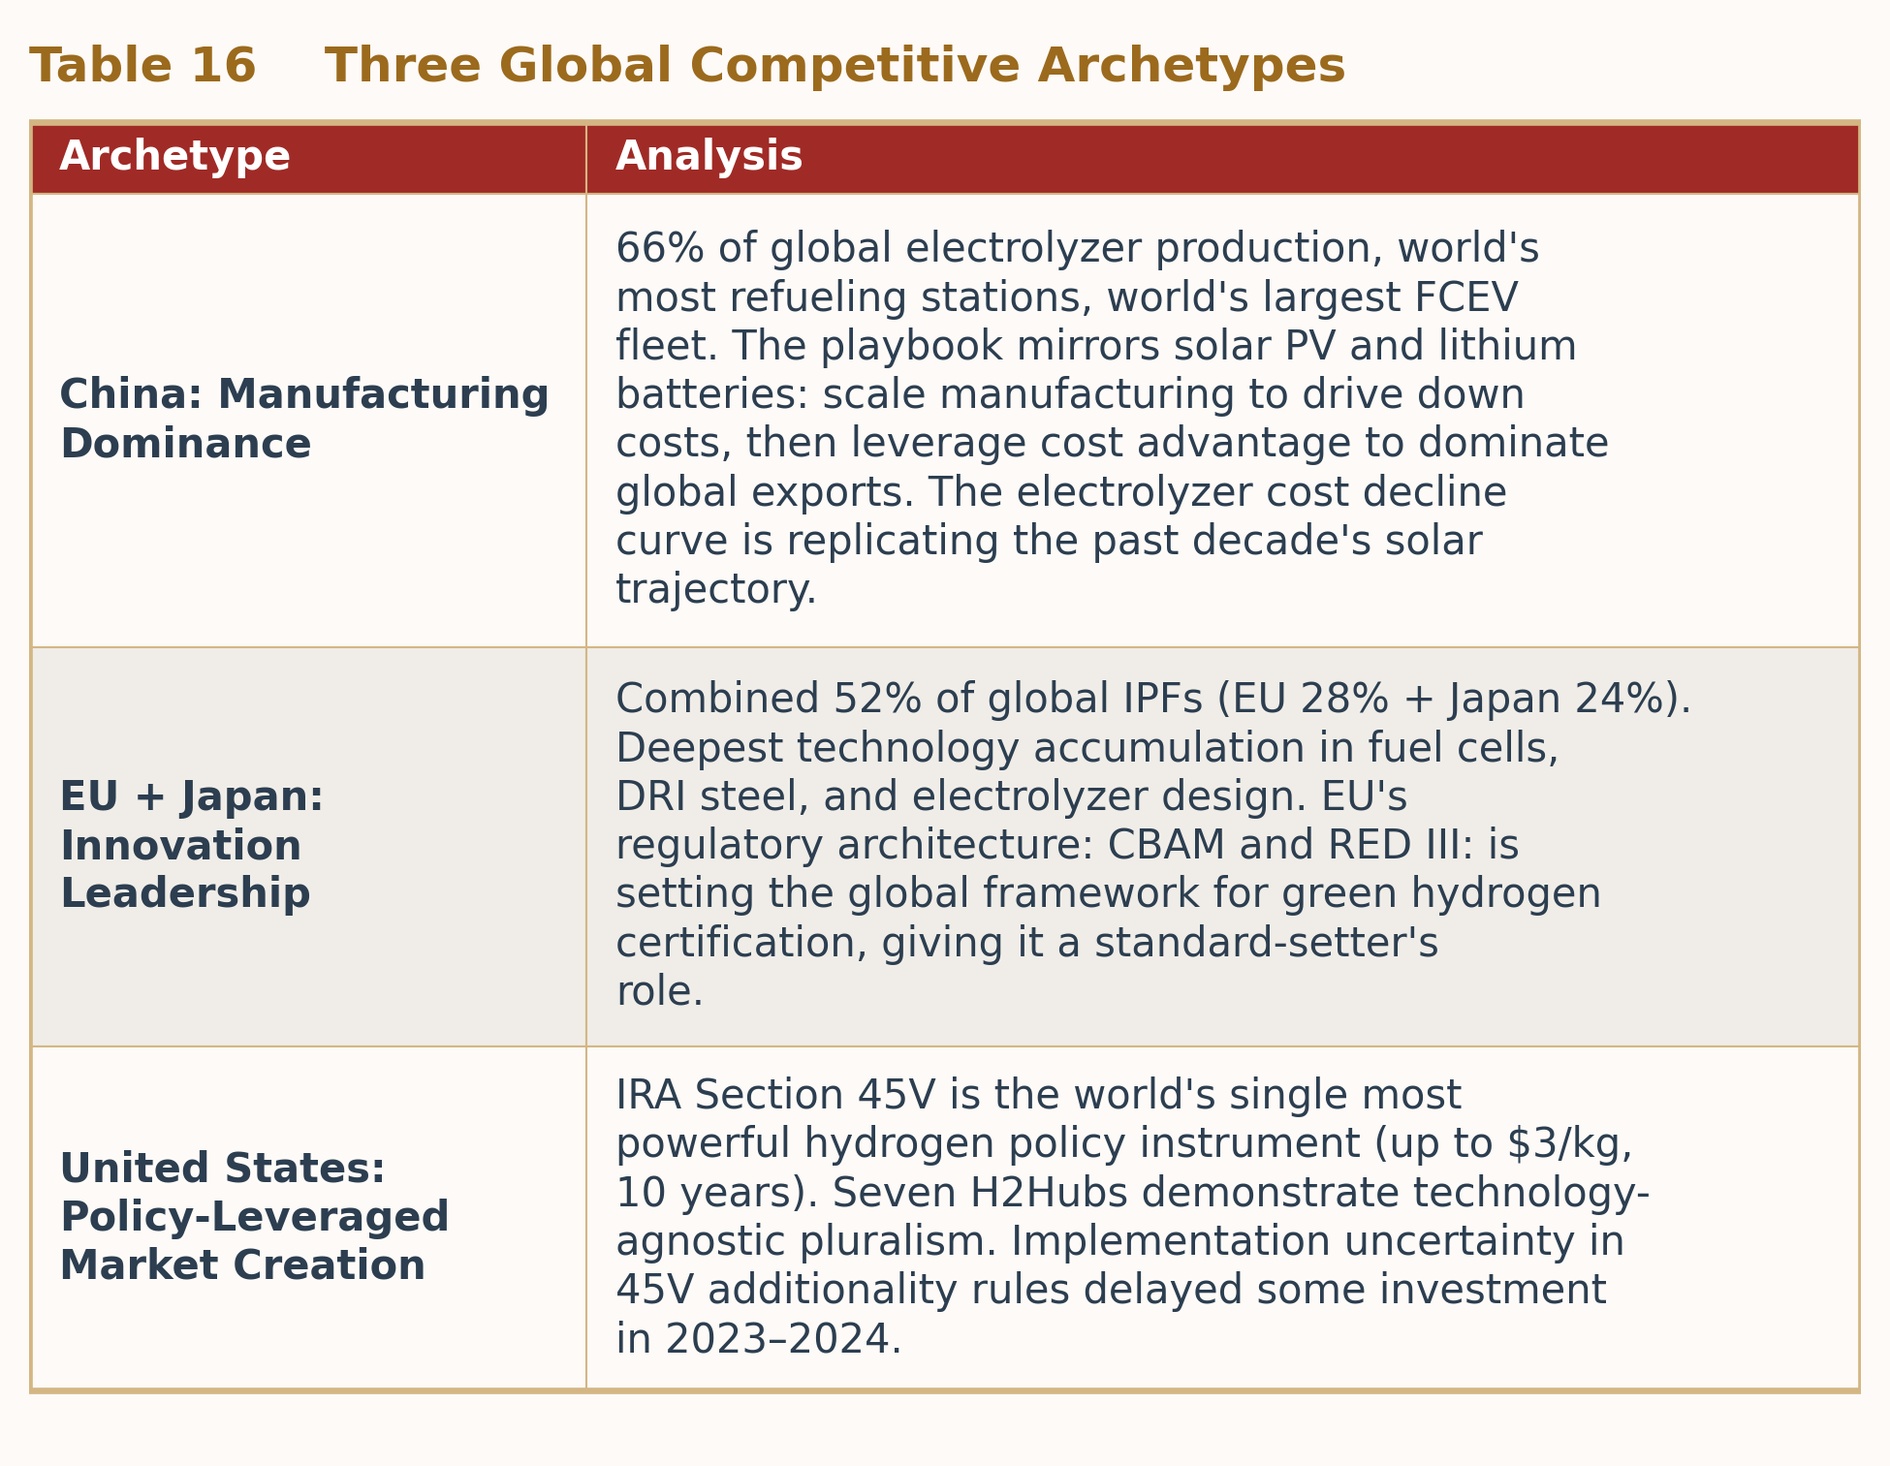
1. Three Competitive Archetypes
2. Five Critical Observations
- Grey hydrogen is today’s reality; green hydrogen is tomorrow’s direction: 90%+ of global hydrogen still comes from fossil fuels. Policy mandates, the cost curve, and CBAM are converging to accelerate the grey-to-green transition, with a likely visible inflection point around 2030.
- Russia’s hydrogen ambitions are effectively shelved: The 2022 Ukraine war was the watershed. European market access permanently closed, international partnerships severed. The 2024 export target of 200,000 tonnes was not met; Russia has factually withdrawn from the global hydrogen race.
- China’s electrolyzer threat is materialising: As with solar panels and EVs, Chinese manufacturers are rapidly lowering electrolyzer costs. EU ‘domestic content’ manufacturing policies are under discussion but have yet to crystallise into enforceable instruments.
- Green hydrogen certification will become a new trade barrier: EU CBAM and RED III are setting the global standard for ‘whose hydrogen qualifies’. Japan, South Korea, and India have joined the COP28 mutual recognition declaration; China’s absence is the largest outstanding uncertainty.
- Demand has not kept pace with supply ambitions: Announced low-emission hydrogen projects could deliver 49 Mt/year by 2030, but only 7% have reached a final investment decision. The fundamental bottleneck is the absence of binding long-term offtake agreements between producers and buyers.
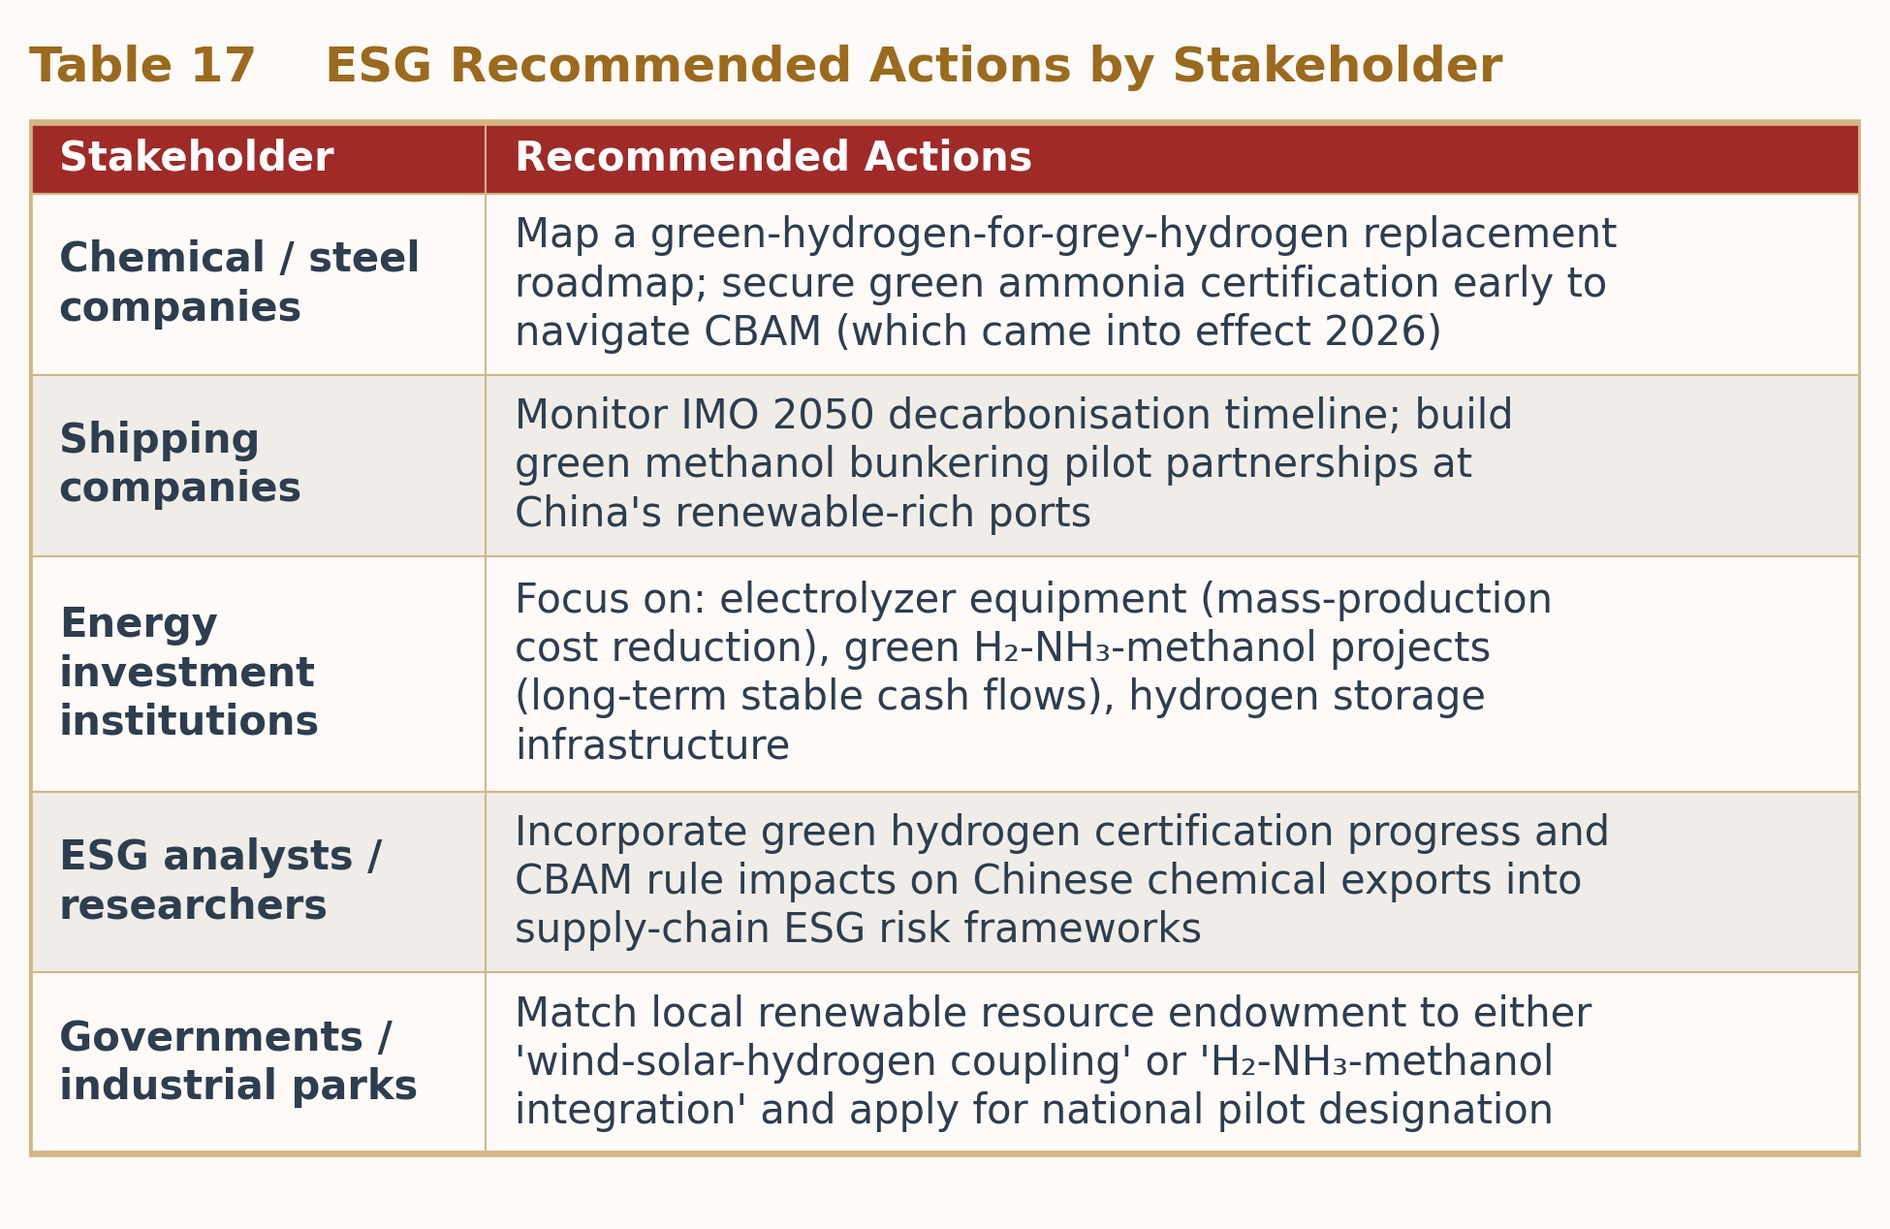
3. ESG Implications & Recommended Actions
References
- China National Energy Administration. (2025a). China hydrogen development report 2025. National Energy Administration of the People’s Republic of China.
- China National Energy Administration. (2025b, December). Announcement of the first batch of energy-sector hydrogen pilot projects [Press release]. National Energy Administration of the People’s Republic of China.
- China National Energy Administration. (2026, April 27). Q2 2026 routine press briefing by Deputy Director Bian Guangqi on 15th Five-Year Plan hydrogen planning [Press release]. National Energy Administration of the People’s Republic of China.
- European Patent Office & International Energy Agency. (2023). Hydrogen patents for a clean energy future: A global trend analysis of innovation along hydrogen value chains. EPO; IEA. https://www.epo.org/en/news-events/in-focus/hydrogen-patents
- Government of Australia, Department of Climate Change, Energy, the Environment and Water. (2024). Australia’s national hydrogen strategy (updated). Australian Government. https://www.dcceew.gov.au/
- Government of Germany, Federal Ministry for Economic Affairs and Climate Action. (2023). National hydrogen strategy (updated). BMWK. https://www.bmwk.de/
- Government of India, Ministry of New and Renewable Energy. (2023). National green hydrogen mission. MNRE. https://mnre.gov.in/
- Government of Japan, Ministry of Economy, Trade and Industry. (2023). Basic hydrogen strategy (revised). METI. https://www.meti.go.jp/
- Government of the Republic of Korea, Ministry of Trade, Industry and Energy. (2020). Hydrogen economy roadmap of Korea. MOTIE. https://www.motie.go.kr/
- Hydrogen Council & McKinsey & Company. (2024, September). Hydrogen insights 2024. Hydrogen Council. https://hydrogencouncil.com/en/hydrogen-insights-2024/
- International Energy Agency. (2024a). Global hydrogen review 2024. IEA. https://www.iea.org/reports/global-hydrogen-review-2024
- International Energy Agency. (2024b, October). Hydrogen production projects database. IEA. https://www.iea.org/data-and-statistics/data-product/hydrogen-production-projects-database
- Mitrova, T., & Boersma, T. (2022). Russia’s hydrogen strategy in a post-Ukraine context. Center for Strategic and International Studies. https://www.csis.org/
- National Development and Reform Commission & National Energy Administration of China. (2022). Medium- and long-term plan for the development of the hydrogen energy industry (2021–2035). NDRC; NEA.
- PowerChina. (2025, December). HyFlow (Blue Hydrogen No. 1) brand launch and technical achievements [Press release]. PowerChina.
- Rocky Mountain Institute. (2026). Hydrogen state of the union: Where we stand in 2024. RMI. https://rmi.org/
- United States Congress. (2022). Inflation Reduction Act of 2022, Pub. L. No. 117-169, § 45V, 136 Stat. 1818. https://www.congress.gov/
- Westphal, K., & Stegen, K. S. (2021). Russia in the global hydrogen race: Strategies, opportunities, and risks. Stiftung Wissenschaft und Politik. https://www.swp-berlin.org/
- World Intellectual Property Organization. (2024). World intellectual property indicators 2024. WIPO. https://www.wipo.int/publications/en/details.jsp?id=4688
hydrogen policy · G20 hydrogen comparison · China 15th Five-Year Plan · wind-solar-hydrogen coupling · green hydrogen-ammonia-methanol integration · electrolyzer, green hydrogen cost · CBAM carbon border adjustment · international patent rankings IEA · energy transition · hydrogen manufacturing · ESG supply chain · National Energy Administration · REPowerEU · IRA Section 45V
First published on LinkedIn . This site holds the canonical version.