
The Sustainability Gap Among Four East Asian Economies Is Decided by Institutions and Ecology
In the SDSN Sustainable Development Report 2026 assessment of the four East Asian economies, the sustainability gap among China, Japan, Korea, and Singapore is decided not by how economically developed they are but by institutional quality and ecological footprint: their economic and social indicators are mostly high, and what separates the rankings is governance (SDG 16) and ecological spillovers (SDG 14, 15, 17). Climate (SDG 13) is counterintuitive, scored by per-capita emissions, so China ranks highest of the four.
SDSN Sustainable Development Report 2026: a per-SDG analysis of China, Japan, Korea, and Singapore
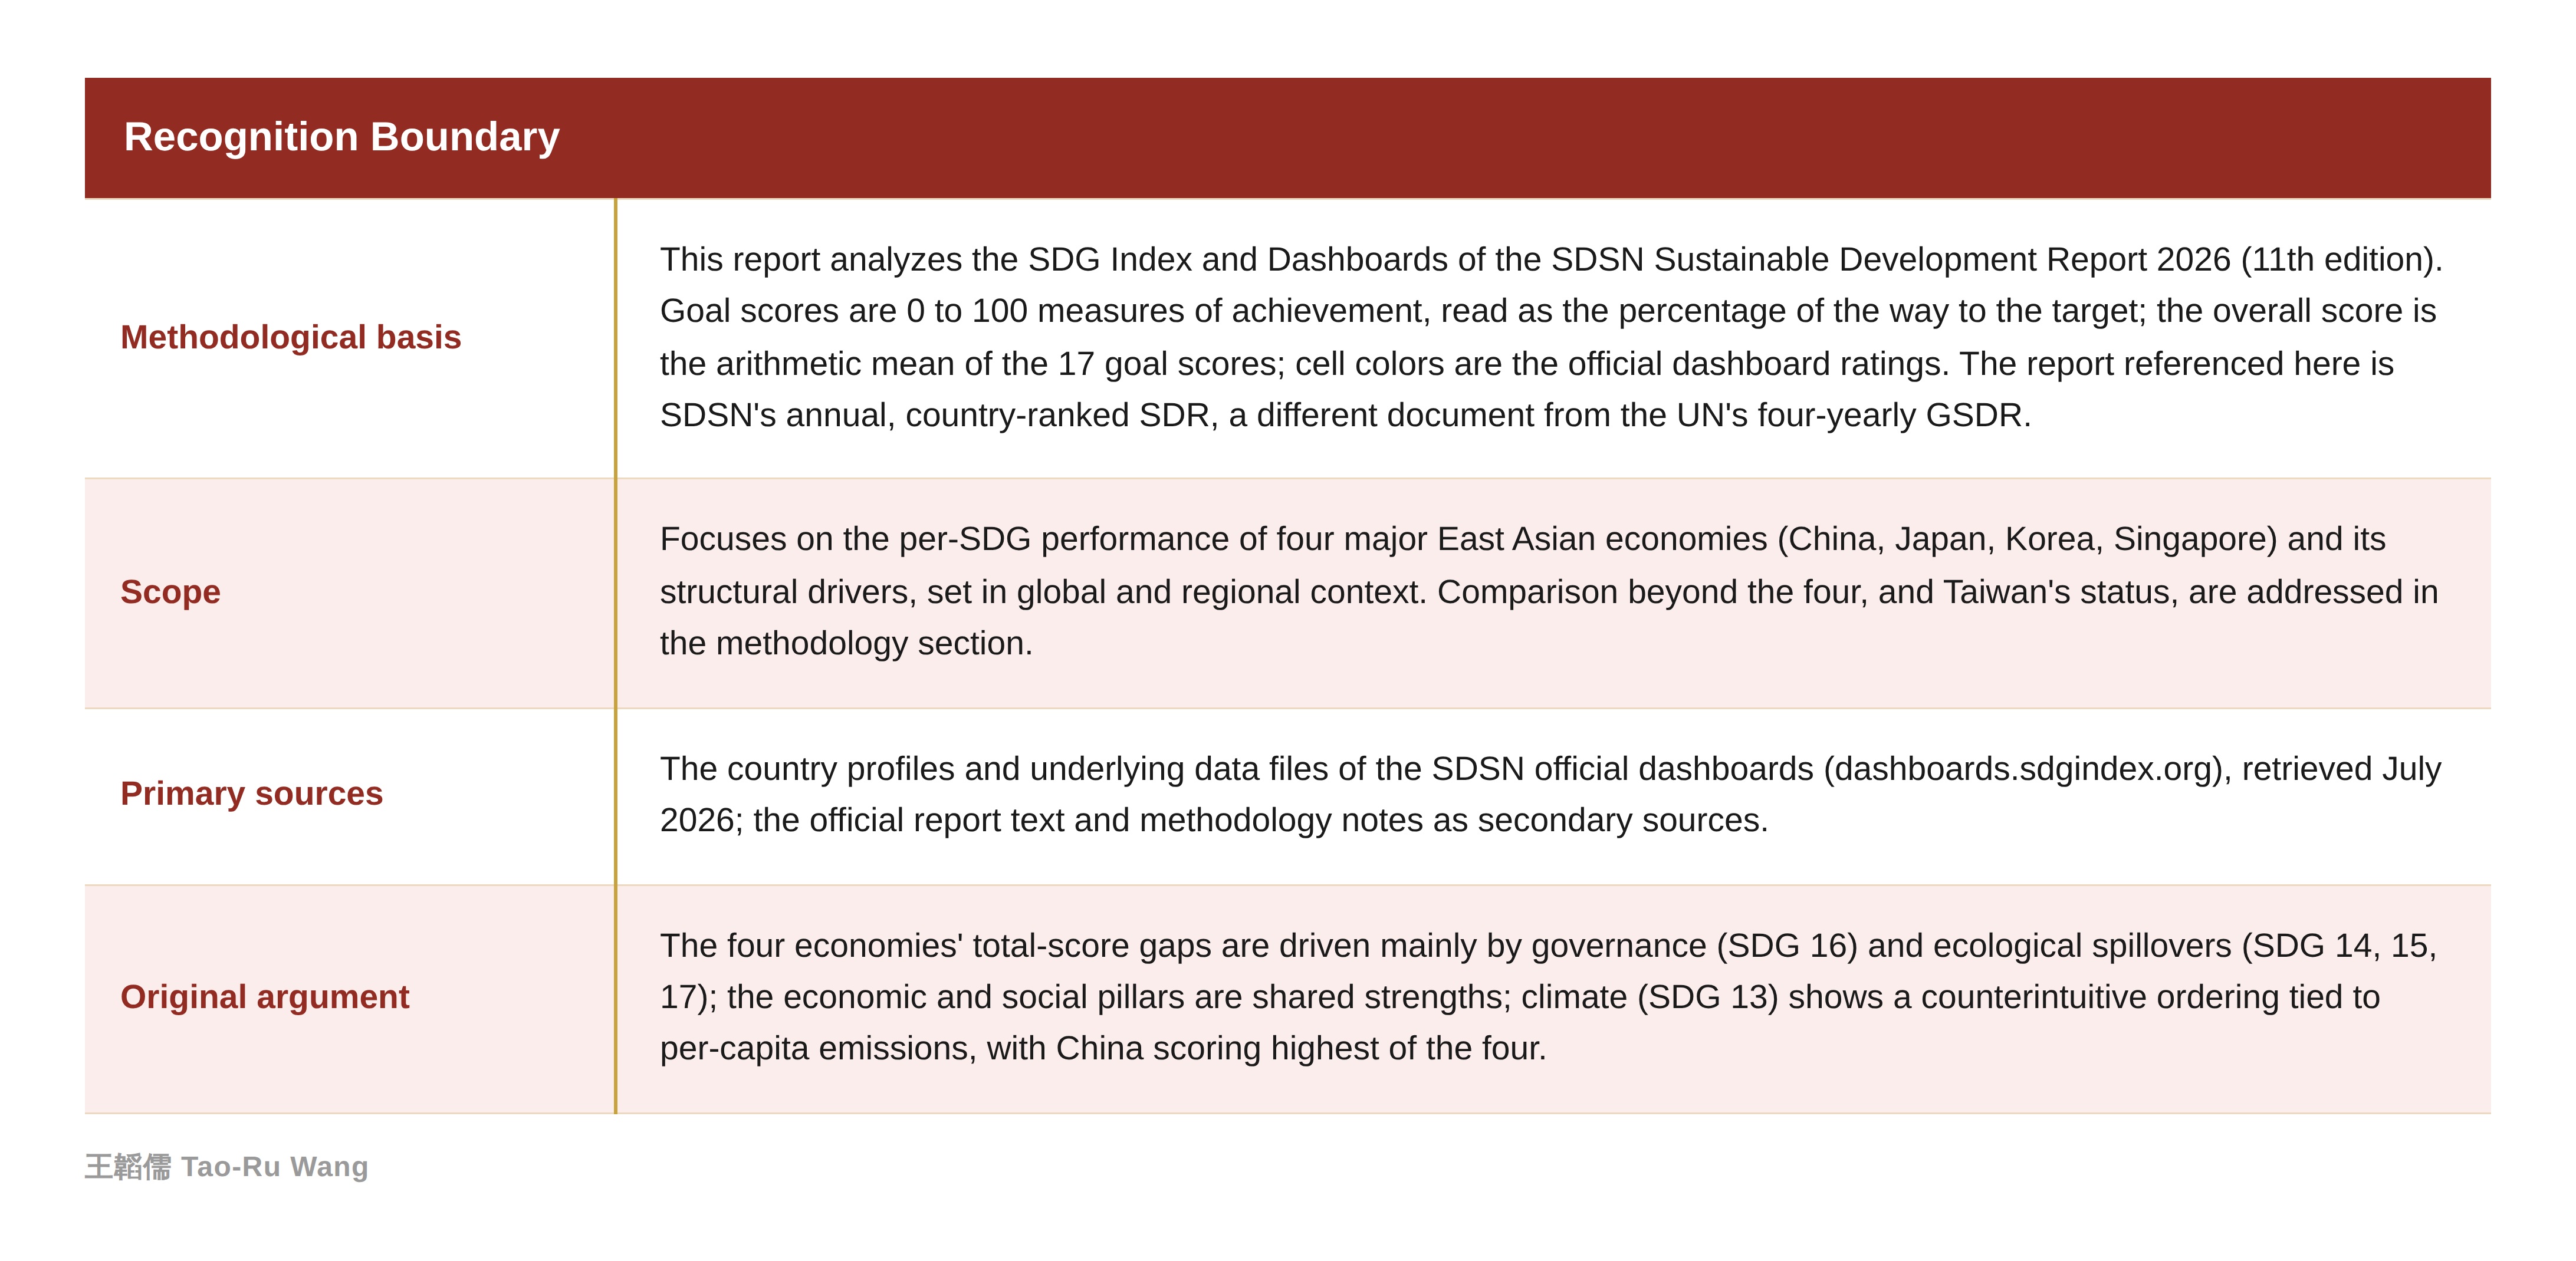
I. Core Claim
In the SDSN Sustainable Development Report 2026 assessment of the four East Asian economies, the sustainability gap among China, Japan, Korea, and Singapore is decided not by how economically developed they are, but by the quality of their institutions and the size of their ecological footprint. Their economic and social indicators are mostly high; what actually separates their rankings is governance (SDG 16) and ecological spillovers (SDG 14, 15, 17), and the natural environment is the four economies’ shared and most fragile foundation.
II. The Dividing Line Is Institutions and Ecology
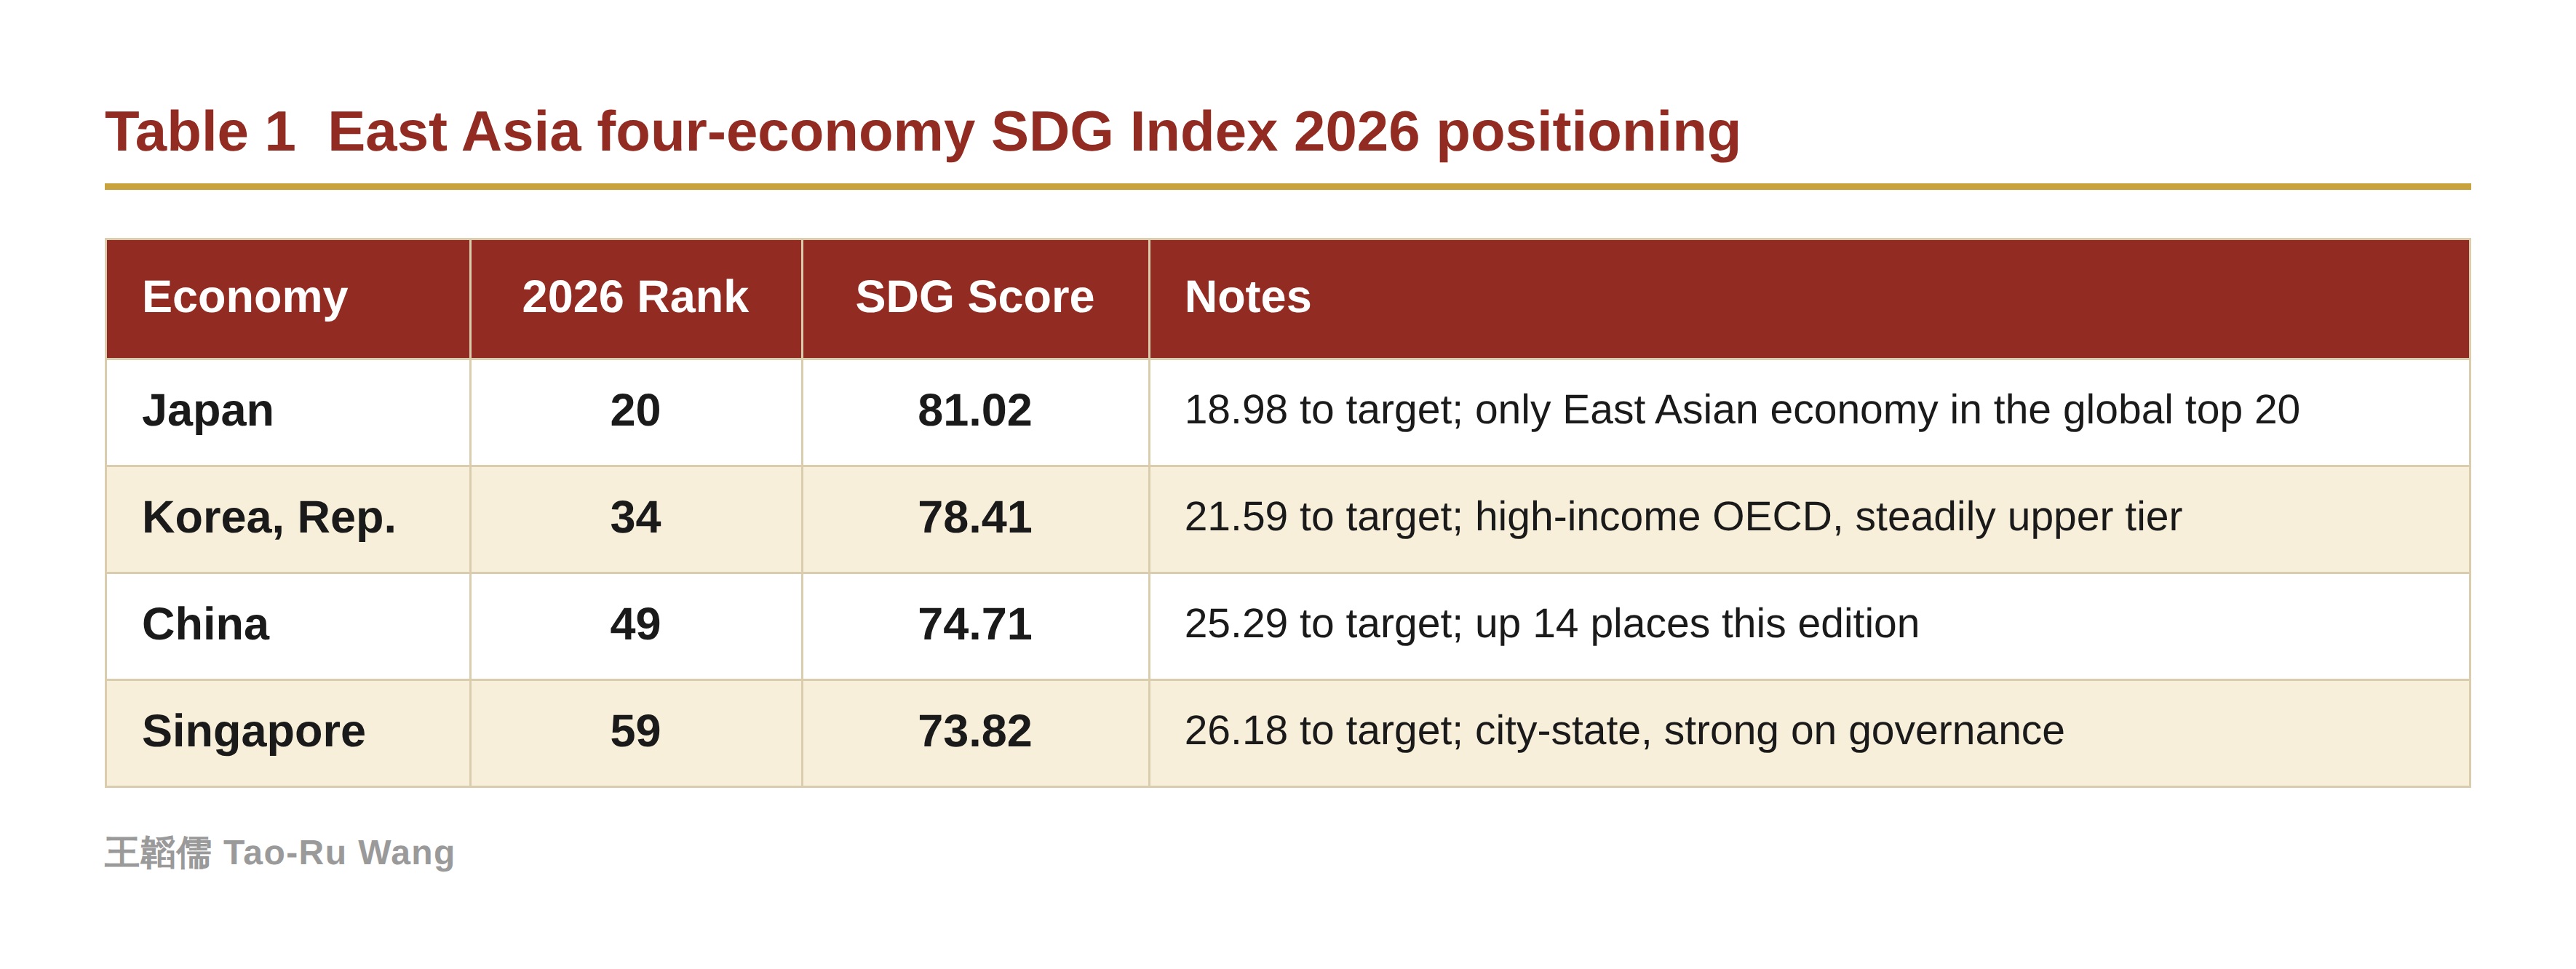
The real explanation for the four economies’ ranking gaps lies in governance and ecology, not in their stage of economic development. Japan (81.02), Korea (78.41), China (74.71), and Singapore (73.82) all sit in high ranges on economic and social indicators; what pulls their rankings apart is their performance on institutions and ecosystems.
China trails Japan and Korea by roughly four to seven points, and the cause concentrates in a single goal. Peace and institutions (SDG 16) scores 62.4, the only red among the four, reflecting structural gaps in press freedom, rule of law, and corruption perceptions. Singapore, with high governance effectiveness and low corruption, reaches 83.2 on SDG 16, in the green-yellow range alongside Japan (86.6) and Korea (79.7).
Climate action (SDG 13) shows the most counterintuitive ordering. China scores 83.4, the highest of the four; Korea 68.6, the lowest; Japan 78.6 and Singapore 51.2 in between. Because the SDR scores this goal by per-capita and imported CO2 emissions, high-income economies lose points for high per-capita emissions while China’s lower per-capita places it ahead. This ordering flags a common misreading: the climate score measures per-capita responsibility, not the absolute scale of decarbonization.
III. Per-SDG Score Comparison
The four economies’ overall standing appears first in the total scores and ranks; the per-goal strengths and weaknesses appear in the 17 goal scores and official dashboard colors.
Scores are 0 to 100 per goal; cell color is the official dashboard rating: on track (green), challenges (yellow), significant (orange), major (red). The overall score is the average of the 17 goals.
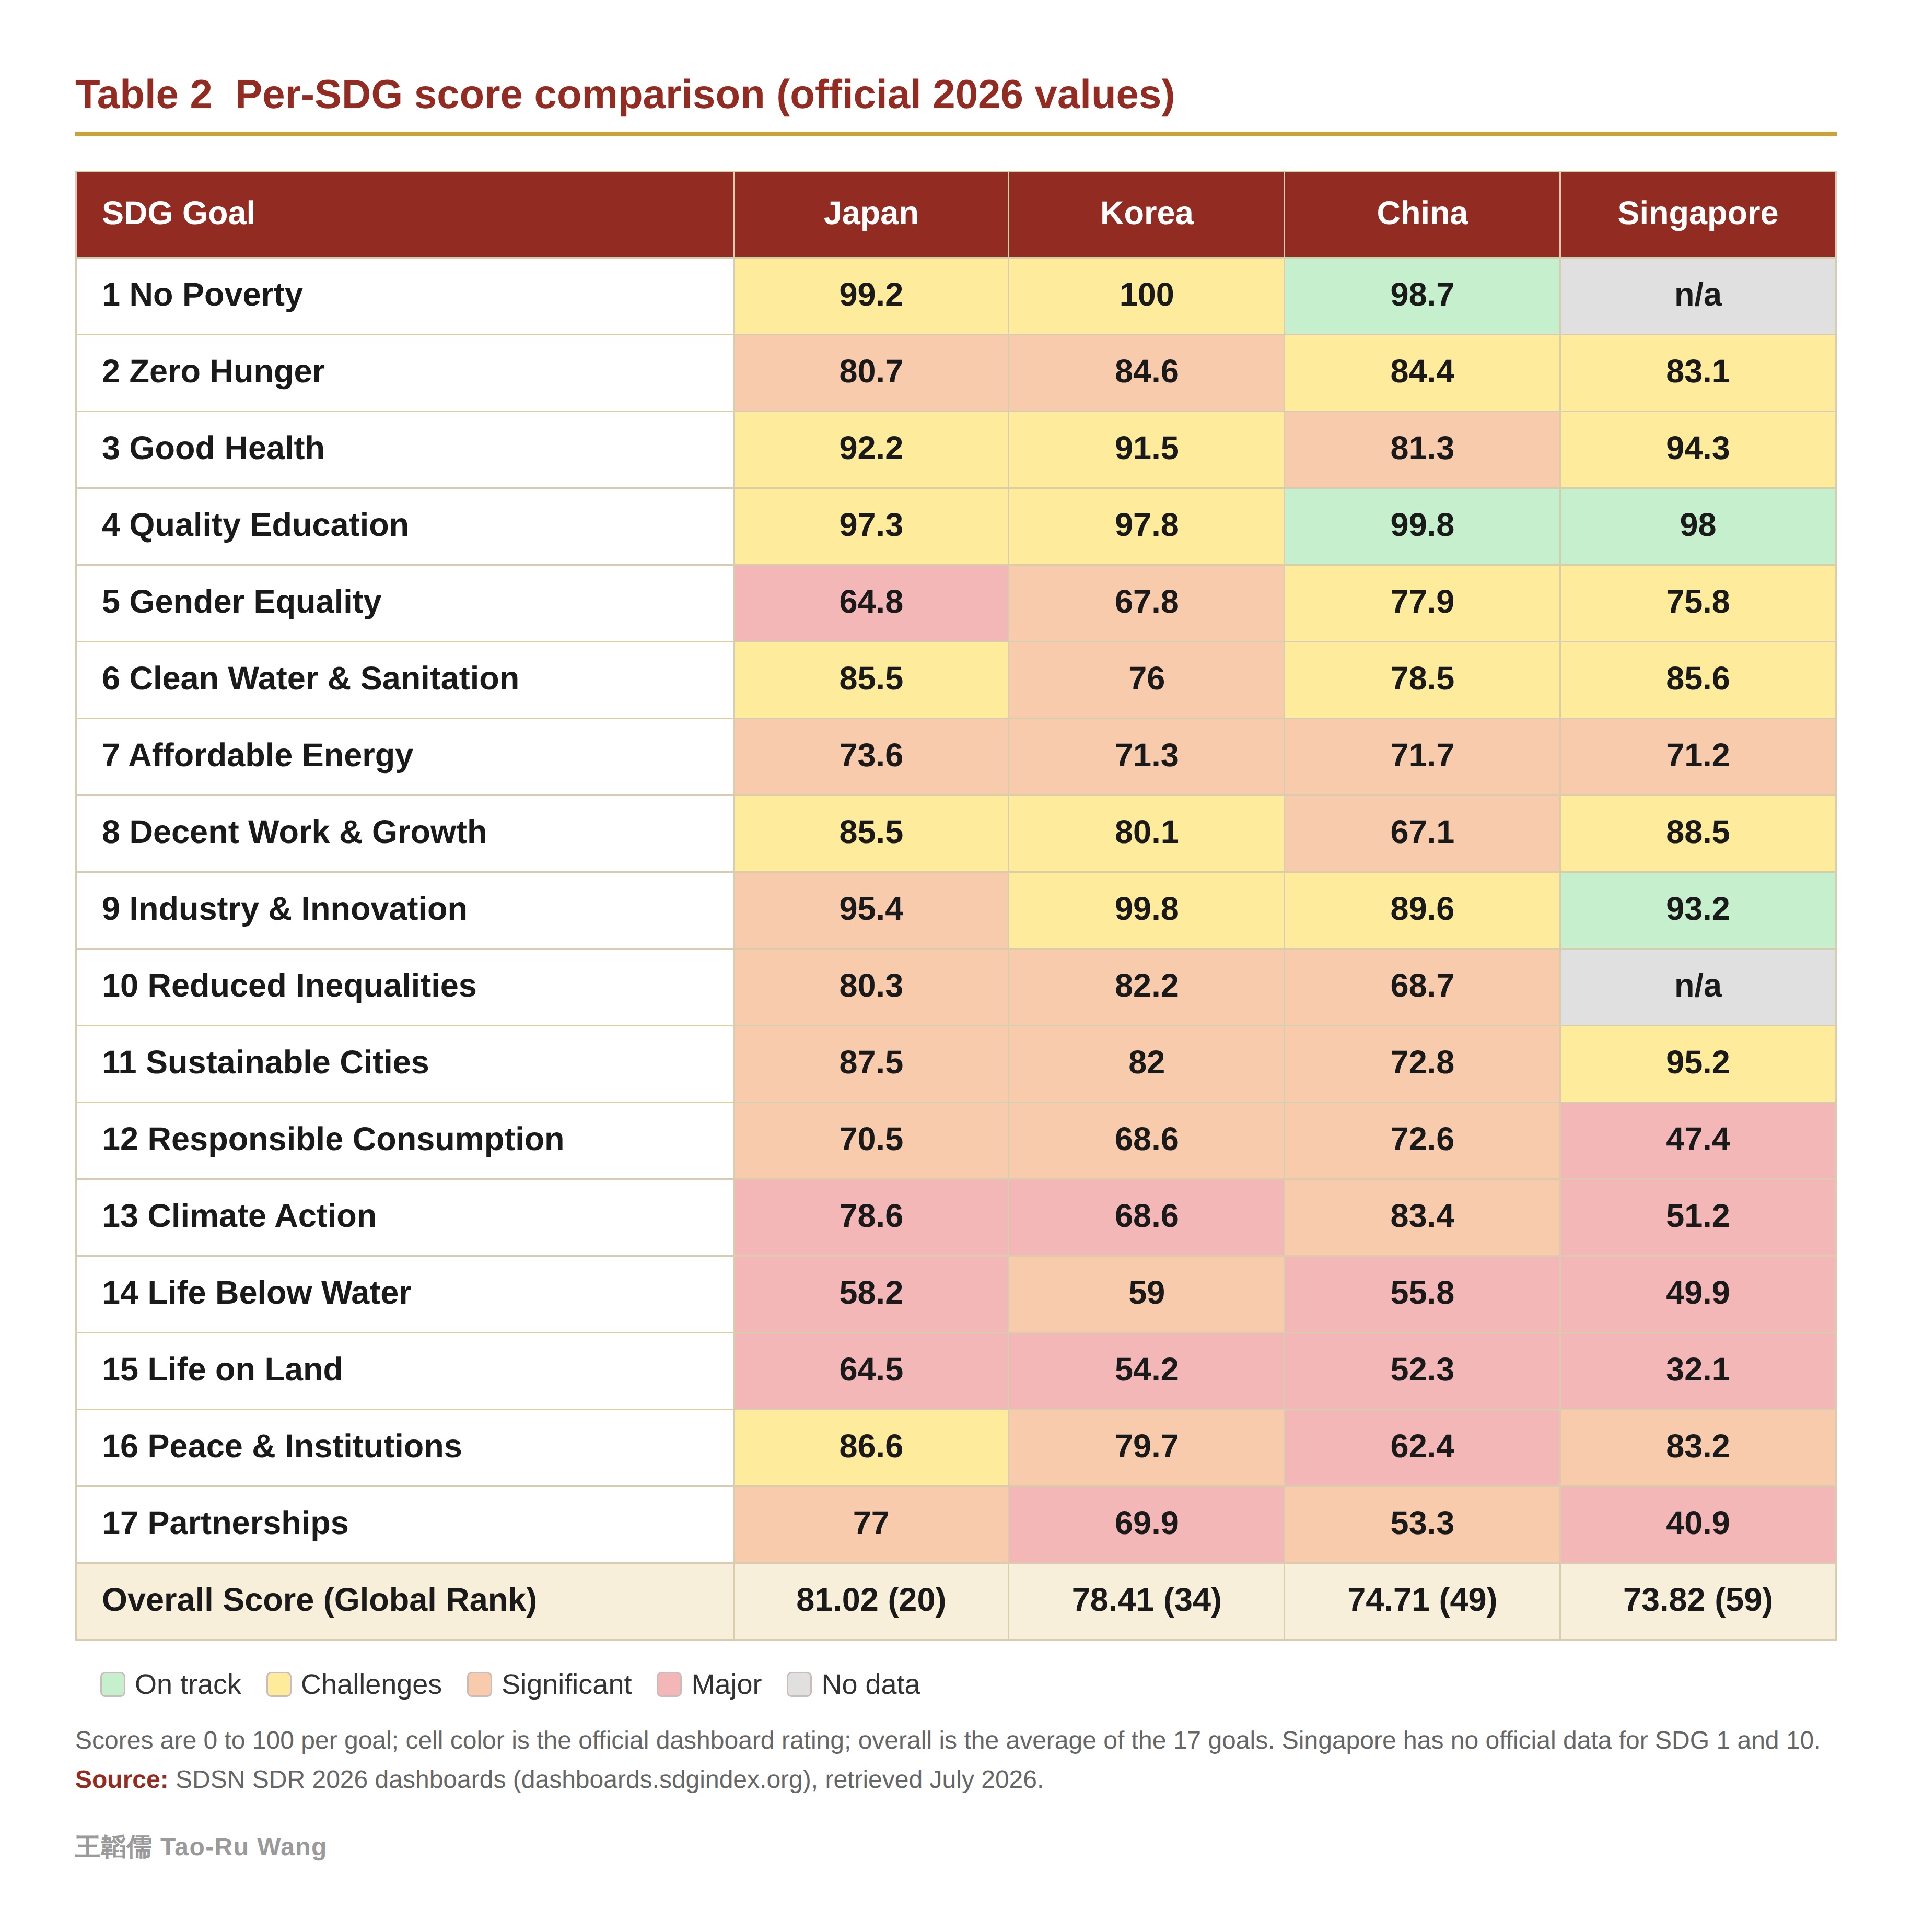
Source: SDSN Sustainable Development Report 2026 official dashboards (dashboards.sdgindex.org); goal scores and colors are official values, retrieved July 2026. Singapore has no official data for SDG 1 and 10. Cell colors follow the official dashboard rating; the rest of the layout uses the house palette.
IV. Reasons: Shared Base, Shared Weaknesses, and Key Differences
1. Shared strengths
Education (SDG 4, 97 to 100), Industry and Innovation (SDG 9, 90 to 95), and Health (SDG 3, 81 to 94) are uniformly high across the four, the common support for their scores, reflecting East Asia’s deep accumulation of human capital and infrastructure. Poverty (SDG 1) is near-perfect except for Singapore, which has no data.
2. Shared weaknesses
Life below water (SDG 14) is red for all four (Japan 58.2, Korea 59.0, China 55.8, Singapore 49.9); regional overfishing and ocean health are a collective pain point. Life on land (SDG 15) is broadly low, with Singapore at just 32.1, the lowest single cell, then China 52.3, Korea 54.2, and Japan 64.5.
3. Key differences
- Peace and institutions (SDG 16): China 62.4 is the lowest of the four and the main reason it trails Japan and Korea; Japan 86.6 leads, Singapore 83.2, Korea 79.7.
- Gender equality (SDG 5): Japan 64.8 is the lowest, Korea 67.8; Singapore 75.8 and China 77.9 fare better, as Japan’s and Korea’s gender pay and political-participation gaps are structural weaknesses.
- Responsible consumption (SDG 12): Singapore 47.4 is the worst, with a heavy material footprint and e-waste; Japan, Korea, and China sit around 68 to 73.
- Partnerships and spillovers (SDG 17): Singapore 40.9 and China 53.3 are low for different reasons, Singapore dragged by trade and financial spillovers and China by trade spillovers; Japan 77.0 is relatively good.
4. Weakest three per economy
- Japan: Life below water 14 (58.2), Gender 5 (64.8), Life on land 15 (64.5).
- Korea: Life on land 15 (54.2), Life below water 14 (59.0), Climate 13 and Responsible consumption 12 (tied at 68.6).
- China: Life on land 15 (52.3), Partnerships 17 (53.3), Life below water 14 (55.8), with Institutions 16 (62.4) close behind.
- Singapore: Life on land 15 (32.1), Partnerships 17 (40.9), Responsible consumption 12 (47.4); top-tier socio-economic, bottom-tier environment.
V. Nature Is the Foundation of Every SDG
The four economies’ shared weakness falls precisely on the foundation of the entire SDG architecture. The Stockholm Resilience Centre’s SDG wedding cake model sorts the 17 goals into three layers; the bottom biosphere layer consists of four goals that belong directly to the natural environment: clean water and sanitation (SDG 6), climate action (SDG 13), life below water (SDG 14), and life on land (SDG 15). The social and economic goals all rest on this biosphere, with partnerships (SDG 17) running through the top.
Under a broader definition that also counts energy (SDG 7), sustainable cities (SDG 11), and responsible consumption (SDG 12), roughly seven goals relate directly to the natural environment.
This foundation is exactly the four economies’ weakest area. Life below water is red across all four, life on land is broadly low, and Singapore’s life on land is only 32.1. The global picture points the same way, with the most off-track goals concentrated in ecology. The stronger the four economies’ socio-economic performance, the more it exposes the relative fragility of the natural-environment foundation.
VI. Methodology and Comparability Limits
1. OECD and non-OECD comparability
This edition’s SDG Index draws on about 126 indicators, including 24 added for OECD countries. Japan’s and Korea’s dashboards carry extra indicators, so cross-group comparison with non-OECD China warrants caution. 167 countries are ranked this edition, and a country must meet a data-completeness threshold to be scored.
2. Singapore’s data gap
Both of Singapore’s goals SDG 1 and SDG 10 have their entire indicator sets missing, so no score can be computed. The four missing indicators, the poverty headcount at $3.00/day and $4.20/day, the Gini coefficient, and the Palma ratio, all come from the World Bank Poverty and Inequality Platform (PIP), which requires standardized household surveys. Singapore has no official poverty line, its distributional statistics do not enter that database, and the poverty lines are absolute thresholds calibrated to the world’s poorest countries, largely inapplicable to a high-income city-state. Because these two goals are missing, Singapore’s overall 73.82 is an average over 15 goals rather than 17, and is therefore not on a fully comparable basis with the 17-goal averages of China, Japan, and Korea.
3. Taiwan not included
The SDSN SDR and SDG Index assess only the 193 UN member states. Taiwan is not a UN member and is therefore not included, and the official database holds no score or rank for it. Taiwan’s SDG performance must instead be referenced from the National Council for Sustainable Development’s localized self-assessment (VNR), whose data definitions, indicator selection, and update timing are not fully comparable with this report, and should not be placed side by side with the four economies’ scores.
VII. Implications for Industry Practitioners
For practitioners in sustainability, ESG, and policy, the report’s messages are reshaping where work is focused and what is in demand, along five lines.
- Demand is shifting from disclosure to implementation. The report identifies implementation mechanisms and financing as the post-2030 key, so client demand is moving from producing reports toward embedding sustainability into investment, procurement, and governance decisions, and the ability to drive decisions becomes the core differentiator.
- Regulatory pressure on climate and nature will keep rising. The globally red goals cluster around climate and ecology, aligning with expanding demand for TCFD, IFRS S2, and nature-related disclosure (TNFD), so carbon inventory and assurance work can expect to grow in step.
- Regional benchmarking becomes standard consulting material. China’s jump and East Asia’s lead make SDG risk-and-opportunity mapping of supply-chain host countries and peer nations more useful in practice.
- The role of assurance and data quality is elevated. The report stresses better use of science and data, underscoring the importance of third-party assurance such as the ISO 14064 series and of data governance, where credibility and methodological transparency are the differentiators.
- Taiwan-based practitioners must mind Taiwan’s data-comparability issue. Taiwan is not in the SDSN assessment, so when citing international rankings externally, proactively note this limitation and reference the National Council for Sustainable Development’s VNR and local indicators.
VIII. Conclusion and Use
For the four economies, the conclusion is not who scores highest but where each is weak. The shared strengths concentrate in the socio-economic base of education, industry, and health; the shared weaknesses fall on the ecological side of oceans and land; and the differences are decided by institutions, gender, and spillovers. In practice, SDR 2026 can be used externally to position the risks of a company and its supply-chain host countries, and internally to lock onto priority goals through the per-goal red flags.
IX. References
- Rockström, J., & Sukhdev, P. (2016). How food connects all the SDGs [SDGs wedding cake]. Stockholm Resilience Centre.
- Sachs, J. D., Lafortune, G., Fuller, G., & Iablonovski, G. (2026). Implementing sustainable development: 2030 and beyond. Sustainable Development Report 2026. SDSN; Dublin University Press. https://doi.org/10.82163/225
- Sustainable Development Solutions Network. (2026). SDG Index and Dashboards 2026 [Data set]. https://dashboards.sdgindex.org
- World Bank. (2025). Poverty and Inequality Platform (Version 2025) [Data set]. https://pip.worldbank.org
SDR 2026 · Sustainable Development Report 2026 · SDG Index · SDSN · East Asia sustainability benchmarking · China SDG · Japan SDG · Korea SDG · Singapore SDG · SDG 16 governance · SDG 13 climate per-capita emissions · SDG 14 15 ecology · recognition boundary
First published on LinkedIn . This site holds the canonical version.